On this page
- What the CAC payback period is
- The CAC payback period formula
- How to calculate CAC payback period
- An example calculation: Larkspur’s quarter
- Important assumptions behind the number
- Time value of money and churn
- What is a good CAC payback period?
- CAC payback period benchmarks
- How public companies define CAC payback
- CAC payback vs LTV:CAC
- How to improve CAC payback period
- Common mistakes
CAC payback period turns a sales and marketing budget into a number a founder can plan cash around: how many months until the customers it bought have paid it back. This page gives the formula, the steps, a worked example on a made-up company, the assumptions that change the answer, the benchmarks with their samples, and the way three companies define the metric in their SEC filings. It belongs to SaaS metrics. The rate at which customers leave, which the basic formula ignores, is covered in SaaS churn rate, and the recurring-revenue figures it divides by are explained in ARR vs MRR.
What the CAC payback period is
The CAC payback period is the number of months a company needs to recoup the initial costs of acquiring a new customer7. It is a SaaS metric that measures how long it takes to earn back spending on new customers, namely sales and marketing expense7. Customer acquisition cost, CAC, is the cost; payback is the clock. The clock only counts gross profit, because CAC payback looks at how much profit a customer will bring to the business, not total revenue10.
Bessemer, the venture firm whose benchmark report is used below, explains why the timing matters: only after CAC is repaid is the company generating profit on that customer, and during the payback period it is simply recovering the money spent to acquire the customer5. The result is a cash number as much as an efficiency number. CAC ties up working capital, and the longer the payback period, the longer the cash takes to come back6. Wall Street Prep puts a ceiling on it: the payback period determines the amount of cash a company needs to fund its growth strategies, so it sets a limit on what can reasonably be spent on acquiring customers7.
The CAC payback period formula
Three inputs are needed: sales and marketing expense, new MRR and gross margin10. The most-quoted form divides the expense by the margin-adjusted new revenue7.
| Formula | CAC payback period = sales and marketing expense ÷ (new MRR × gross margin)7 |
| Same thing, per customer | CAC ÷ (MRR per customer × gross margin)8 |
| With ARR instead of MRR | Multiply by 12 to put the result in months6 |
| Result | Months to recover the acquisition cost10 |
Published recipes differ in what they put in each input. This table lines up the ones used below.
| Source | Recipe |
|---|---|
| Wall Street Prep | Sales and marketing expense ÷ (new MRR × gross margin)7 |
| Corporate Finance Institute | CAC ÷ (MRR per customer × gross margin), with new MRR counted as the new and expansion revenue in the period8 |
| The SaaS CFO | CAC ÷ the gross margin dollars the customer generates; cohort ARR is the average ACV landed from new customers, not the ARPA of the whole base6 |
| Klaviyo, registration statement | 12 ÷ [(change in revenue over twelve months × gross margin) ÷ selling and marketing expense over the same twelve months]1 |
| ServiceTitan, registration statement | Trailing-four-quarter customer acquisition costs ÷ (platform gross margin for those quarters minus platform gross profit for the prior four quarters), × 122 |
| Xometry, registration statement | Average months required to fully recoup CAC in the reporting period3 |
Wall Street Prep adds a warning that there are numerous other ways to calculate CAC payback, so the pros and cons of each need to be understood7. One example: the net new MRR metric, which is new MRR adjusted for expansion MRR and churned MRR, could be used as the recurring-revenue component7.
How to calculate CAC payback period
- Total the acquisition spend. Take fully loaded sales and marketing costs from the P&L, and allocate the spend between new and existing customers6. The spend usually includes marketing, sales staff and other direct acquisition costs8.
- Count the new customers and their new MRR. CAC is the spend divided by the customers acquired in the same period9. New MRR is the recurring revenue those customers brought in10.
- Apply gross margin. Use the margin on subscription revenue, since the variable costs of delivering the product do not accrete to profit5.
- Divide. Divide the CAC by the monthly gross profit per customer, or the whole spend by the whole cohort's monthly gross profit. The result is months8, 7.
An example calculation: Larkspur’s quarter
Worked example (our arithmetic): Larkspur, one quarter (formula from7, per-customer form from8)
Larkspur is a made-up software company. All inputs are invented round numbers.
| Input | Amount |
|---|---|
| Sales and marketing expense in the quarter | $450,000 |
| New customers won | 90 |
| New MRR from those customers | $60,000 |
| Gross margin on subscription revenue | 80% |
| Step | Calculation | Result |
|---|---|---|
| CAC per customer | $450,000 ÷ 90 | $5,000 |
| MRR per customer | $60,000 ÷ 90 | $667 |
| Monthly gross profit per customer | $667 × 0.80 | $533 |
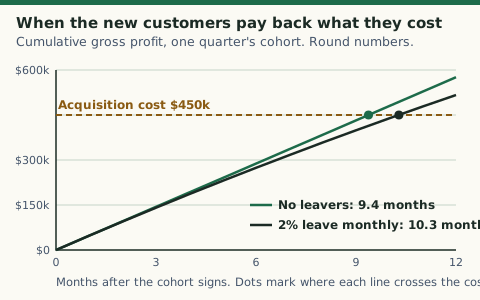
| CAC payback period, per customer | $5,000 ÷ $533 | 9.4 months |
| Check, whole cohort | $450,000 ÷ ($60,000 × 0.80) | 9.4 months |
The cohort check is exact: $450,000 ÷ $48,000 = 9.375 months. The per-customer line uses rounded dollars and lands on the same answer.
The same company under three recipes
The answer changes with the recipe, not with the company.
Worked example (our arithmetic): Larkspur under three recipes (recipes from7 and1)
| Recipe | Extra inputs | Calculation | Result |
|---|---|---|---|
| New-MRR recipe | None | $450,000 ÷ ($60,000 × 0.80) | 9.4 months |
| New-MRR recipe, 2% of revenue leaving each month | Monthly retention 0.98 | Months n where $48,000 × (1 − 0.98^n) ÷ 0.02 = $450,000 | 10.3 months |
| Klaviyo-style recipe | S&M over 12 months $1,800,000; revenue from $6,000,000 to $8,400,000 | 12 ÷ [($2,400,000 × 0.80) ÷ $1,800,000] | 11.25 months |
The Klaviyo-style figure is longest because it divides the trailing year’s spend by the change in total revenue1. That change nets out expansion and any customers lost, so churn shows up in it where the first recipe leaves it out. None of the three is wrong. They answer different questions, which is why a payback figure without its recipe cannot be compared.
Important assumptions behind the number
Each input hides a choice. Write the choice down next to the number.
- Which revenue counts as new. Corporate Finance Institute counts the new and expansion revenue associated with new and existing customers8. Others note that some companies use net new MRR to account for churn, and that expansion MRR from existing customers can be included or excluded10. If existing customers are in the calculation, adjust the formula to include expansion MRR10.
- Which spend counts. Sales and marketing expense covers sales teams, digital marketing, ad spending, search engine marketing and related tactics7. Bessemer’s version also includes customer success expenses, at least the portion tied to renewal, upsell and cross-sell5. ServiceTitan adds the costs of implementation services to complete onboarding2.
- Which margin applies. SaaS gross margin is revenue less cost of goods sold, and the largest costs are usually hosting and onboarding7. Klaviyo and ServiceTitan both use an adjusted gross profit figure, and Klaviyo’s recipe also takes out stock-based compensation1, 2.
- Which period. A monthly, quarterly or trailing twelve-month window changes the noise in the figure. Klaviyo uses twelve months on each side1, ServiceTitan trailing four quarters2.
- Which revenue unit. With ARR in the formula, multiply by 12 to put the result in months, and with MRR drop the multiplication6.
Time value of money and churn
The basic formula leaves two things out. It does not factor in churn or the time value of money6. Churn matters because paying back CAC works like repaying debt out of a stream of income: if a customer leaves, the remaining payments still have to be made, and the next customers have to cover the acquisition cost of those who left6. Wall Street Prep reaches the same point from the risk side: the longer recovery takes, the greater the risk of losing the upfront investment, because of weak retention and lost profits7. The Larkspur table shows the size of the effect: 2% of revenue leaving each month adds about a month to a payback of just over nine (our arithmetic from that table).
The time value of money is the second gap. The formula does not account for the fact that CAC is paid off over time, and a dollar in the future is worth less than a dollar today6. With long payback periods the opportunity cost of the tied-up money grows, which makes the practical payback longer than the simple one6. If your own growth requires borrowing or raising to fund acquisition, that is the cost to weigh against the simple number. The churn page has the monthly-to-annual conversion needed to put a monthly leaving rate into this kind of check.
What is a good CAC payback period?
There is no single answer, and the sources that give one say so. A strong target is generally less than 12 months, and the ideal can vary significantly with the business model and market dynamics8. A high-touch SaaS business with substantial lifetime value might tolerate a longer period, since the return on each acquisition is greater over time8. The payback figure also has to be evaluated with customer types, revenue concentration, billing cycles and working capital needs before it can be called good or bad7.
Size and segment change the target. Small companies sometimes must have a shorter payback because they have less access to cash than larger ones10. Early-stage businesses can have longer payback periods because they invest heavily to build an initial customer base and find product-market fit9. B2B businesses often have longer sales cycles and higher CACs than B2C9, and selling to enterprise customers usually brings higher annual contract values but also longer sales cycles9.
CAC payback period benchmarks
Read the sample before the number. These are the benchmarks used by finance teams, with their source and what they cover.
| Source and scope | Figure |
|---|---|
| Bessemer, average across its cloud portfolio, companies with $1-10MM ARR | 15 months5 |
| Bessemer targets, SMB-focused accounts | Under 12 months5 |
| Bessemer targets, mid-market-focused accounts | Under 18 months5 |
| Bessemer targets, enterprise-focused accounts | Under 24 months5 |
| Stripe, SaaS in general | 12 months or less is typically considered healthy; high performers often reach five to seven months9 |
| Wall Street Prep, SaaS startups | Most viable ones are under 12 months7 |
| Corporate Finance Institute | A strong target is generally under 12 months8 |
| Klaviyo registration statement, quarter ended June 30, 2023 | 14 months1 |
| ServiceTitan registration statement, as of July 31, 2024 | About 21 months2 |
| Xometry registration statement, U.S. marketplace, years ended December 31, 2020 and 2019 | 2.1 months and 3.5 months3 |
Bessemer’s sample is its own cloud portfolio: it has made over 200 cloud investments and runs one of the largest cloud portfolios of any venture firm5. It explains why its segment targets differ: SMB, mid-market and enterprise buckets tend to have different annual contract values and churn rates, so enterprise-focused companies can support longer payback periods5. Shorter is always better within any segment, since customers only become profitable after payback5.
The editors’ reading: the “12 months” figure repeats across four secondary sources without a stated sample7, 8, 9, 10, while the only segmented benchmark comes from Bessemer’s portfolio5. The filings are a useful reality check. Klaviyo’s 14 months and ServiceTitan’s 21 months sit on either side of the headline rule, and each reflects its own recipe1, 2. Benchmark against companies that sell at your price point: The SaaS CFO warns that aggregate SaaS benchmarks are dangerous, and says to benchmark by firmographics6.
How public companies define CAC payback
The SEC’s guidance on key performance indicators asks a company to give a clear definition of the metric and how it is calculated, and a statement of why it gives useful information to investors4. It also asks whether prior metrics should be recast when the method changes4. Both Klaviyo and ServiceTitan label the gross profit in their formulas non-GAAP1, 2, a category the Commission keeps apart from operating statistics such as numbers of subscribers, which it has said are not non-GAAP financial measures4. Three registration statements show what that looks like for payback.
Klaviyo’s amended S-1 defines CAC payback as the number of months it would take for gross profit, adjusted for stock-based compensation, to exceed adjusted selling and marketing expenses1. The calculation starts from the change in revenue over the twelve months to the date of determination, multiplies it by the gross margin of those twelve months excluding stock-based compensation, and divides by selling and marketing expense for the same period, adjusted for stock-based compensation and the amortization of a prepaid marketing expense tied to the Shopify Warrants1. The company takes the quotient of 12 and the result1. It reported 14 months for the quarter ended June 30, 20231.
ServiceTitan’s amended S-1 divides customer acquisition costs for the trailing four quarters by the platform gross margin for those quarters minus the platform gross profit for the prior four quarters, then multiplies by 12 to give months2. Its customer acquisition costs include up-front sales and marketing costs and the costs of implementation services to complete onboarding2. It reported approximately 21 months as of July 31, 20242.
Xometry’s amended S-1 uses a simpler description for its U.S. marketplace: the average number of months required to fully recoup CAC in the reporting period3. It reported 2.1 months for 2020 and 3.5 months for 2019, next to an LTV/CAC ratio that shows the average LTV buyers are expected to generate as a multiple of CAC3. A marketplace with fast repeat orders and a subscription business with annual contracts will not sit on the same scale.
CAC payback vs LTV:CAC
The two ratios answer different questions. The payback period shows how soon the money comes back, and the LTV:CAC ratio shows how much comes back in total. Stripe’s framing: the ratio is primarily concerned with long-term profitability and the return on acquisition efforts, and a generally accepted benchmark for a healthy ratio is 3:1 or higher, meaning lifetime value is at least three times the cost of acquisition9. Bessemer reaches a similar threshold: it recommends investing in customer acquisition when CLTV over CAC is 3x or more, and experimenting further when it is much lower5. Look at both. A long payback with a very high lifetime value can still work, and a short payback with a low ratio can hide a leaky customer base8, 7.
How to improve CAC payback period
Payback is a ratio, so it improves by cutting the numerator, raising new gross profit, or both. Treat the list as hypotheses to test against your own cohorts.
- Fix the funnel. Look at each type of marketing, such as pay-per-click ads, email and social ads, and see which are most effective10. Segmentation helps by identifying high-value customer profiles with shorter sales cycles and higher lifetime value9.
- Shorten time to value. Self-service onboarding, interactive tutorials and proactive support reduce friction and speed up time to value for new customers9.
- Line up sales and marketing. Consistent messaging, efficient lead handoff and shared accountability for revenue goals keep acquisition spend from leaking between teams9.
- Sell more to existing customers. Upselling to higher-tier plans or cross-selling complementary products makes each dollar go further, but the formula has to be adjusted to include expansion MRR9, 10.
- Review price and margin. A higher gross margin shortens payback, and the margin can be raised by cutting expenses, although fixed costs such as hosting and payroll are hard to reduce10.
- Watch the cash side. Some direct-to-consumer startups that rely on paid channels have aimed to be net profitable on a customer’s first transaction, which makes payback close to zero10.
Common mistakes
The cash consequence of a long payback is the subject of burn rate and runway: every month of payback is a month of cash tied up.
- Using revenue instead of gross profit. Payback measures how much profit the customer brings, not total revenue10.
- Mixing recipes across reports. A Klaviyo-style figure and a new-MRR figure for the same company can differ by months, as the Larkspur table shows.
- Counting the whole customer base’s ARPA. The cohort input is the average ACV landed from new customers, not the ARPA of the entire base6.
- Skipping the allocation. Sales and marketing spend must be split between new and existing customers6.
- Reading payback as a profit measure. After payback, customers start to be profitable; before it, the company is only recovering what it spent5.
- Ignoring churn and the cost of waiting. The simple formula does not factor either in6.
- Quoting a benchmark without its sample. Bessemer’s targets differ by segment for reasons it states5.
Common questions
What is a CAC formula?
CAC, customer acquisition cost, is the money spent winning customers in a period divided by the number of customers won in that period9. The spend usually covers marketing, sales staff and other direct acquisition costs8. Wall Street Prep's example divides $5,600 of sales and marketing by 10 new customers to get $560 per customer7.
What is a good CAC ratio for SaaS?
Usage varies. If it means the LTV:CAC ratio, 3:1 or higher is the benchmark Stripe calls generally accepted9, and Bessemer recommends investing in acquisition when lifetime value over CAC is 3x or more5. If it means the payback period, 12 months or less is typically considered healthy9.
RelatedSaaS churn rate: formula, examples and benchmarksNet revenue retention: formula, example, benchmarksARR vs MRR: difference, formula and when to use each
Sources
- Klaviyo, Inc. Form S-1/A, amendment filed September 11, 2023 (key business metrics: Customer Acquisition Cost Payback Period) · Klaviyo, Inc. (SEC filing) · sec.gov · checked October 21, 2026
- ServiceTitan, Inc. Form S-1/A, amendment filed December 10, 2024 · ServiceTitan, Inc. (SEC filing) · sec.gov · checked October 21, 2026
- Xometry, Inc. Form S-1/A, amendment filed June 29, 2021 · Xometry, Inc. (SEC filing) · sec.gov · checked October 21, 2026
- Commission Guidance on Management's Discussion and Analysis (Release 33-10751): key performance indicators and metrics · U.S. Securities and Exchange Commission · sec.gov · checked October 21, 2026
- Scaling to $100 Million (Atlas, undated page read October 21, 2026; Bessemer cloud portfolio data) · Bessemer Venture Partners · bvp.com · checked October 21, 2026
- CAC Payback Period (SaaS CFO) · The SaaS CFO · thesaascfo.com · checked October 21, 2026
- CAC Payback Period | Formula + Calculator · Wall Street Prep · wallstreetprep.com · checked October 21, 2026
- CAC Payback Period · Corporate Finance Institute · corporatefinanceinstitute.com · checked October 21, 2026
- CAC payback period explained · Stripe · stripe.com · checked October 21, 2026
- CAC Payback Period · Growth Equity Interview Guide · growthequityinterviewguide.com · checked October 21, 2026
Published . Rules and rates change: each source shows the day it was read. Education only, not advice. How we check facts · Report an error.