Net revenue retention, defined
This page is part of SaaS metrics. Net revenue retention, usually shortened to NRR, measures the percentage of recurring revenue kept from a group of customers over time, after expansion, contraction and churn5. It is the one retention number that includes upgrades. A customer who cancels pulls it down. A customer who buys more pushes it up.
The metric travels under other names. Net dollar retention (NDR) and net MRR retention are common synonyms5, and public companies often write “dollar-based net retention rate”3. In an investor update, treat any of them as the same idea with a company-specific recipe attached.
Retention can be measured over any time period, but 12 months is the common choice, because that window works for both annual and monthly subscriptions5. Everything below uses 12 months unless it says otherwise.
How analysts rate NRR in your industry
Analysts rate a net retention rate against an industry benchmark, and it is only worth quoting next to one with the same recipe and the same kind of company. Snowflake monitors a dollar-based net revenue retention rate to measure the growth of existing customers2, and benchmarking against public SaaS companies is of limited use for private ones because of the difference in scale4. That is why industry surveys group private companies by contract size4.
How to calculate net revenue retention
NRR is a cohort measure. The cohort is every customer you had at the start of the period3. You then ask what that same group pays at the end. Customers who joined during the period are left out of the end figure3.
- Fix the start date. Pick the day a year ago and list every paying customer on it, with each one's recurring revenue3.
- Total the starting revenue. This is the denominator, often called Prior Period ARR in filings3.
- Total today's revenue from that same list. Include expansion, subtract contraction and cancellations, and exclude any customer who joined later3.
- Divide. The current total divided by the starting total gives the point-in-time rate3.
The same arithmetic can be written from the movements instead of from two snapshots. Start with the opening revenue, add expansion, subtract contraction and churn, then divide by the opening revenue6. Tools that track every change usually work this way, because rebuilding a year-old cohort from scratch is harder than summing the movements in between5. One edge case is worth knowing: a customer who churns and then reactivates inside the window appears as two separate events, not as a net zero5.
Stripe’s version of the formula takes the beginning recurring revenue, subtracts revenue lost to churn and downgrades, adds revenue from upgrades, and divides by the beginning figure6. The period is your choice: NRR can be calculated on a monthly, quarterly, or annual basis6. Keep the interval the same from one report to the next, or the numbers cannot be compared5.
What counts as revenue
Use recurring revenue only. In the SaaS Capital survey, NRR is December MRR from customers who were also customers the December before, divided by total MRR in that earlier December4. The result can be anything from 0% to well above 100%, because it includes upsells, new product cross-sells, and price increases4. The method should follow a cohort over time for consistency4.
SaaS NRR calculation example
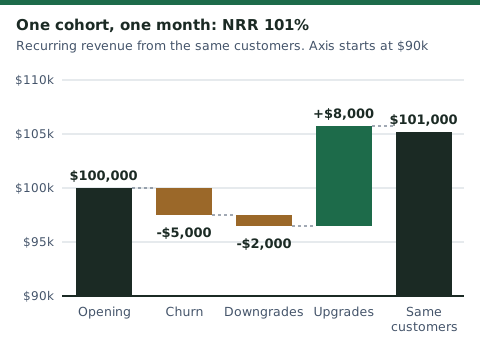
Two published examples show the arithmetic. The first is monthly. A company starts January with $100,000 in recurring revenue from existing customers6. During the month it loses $5,000 to churn, loses $2,000 to downgrades and gains $8,000 from upgrades6. The formula is NRR = [($100,000 - $5,000 - $2,000 + $8,000) / ($100,000)] x 1006. That is $101,000 over $100,000, or 101%6.
The second is annual. A company had four paying customers a year ago, with a total MRR of 7705. Some churned, contracted or expanded, and the same group now pays 8005. To find NRR, divide 800 by 770, which is 103.9%5.
Both results sit above 100%, and both follow one cohort. A customer who arrived after the start date would not change either figure3, 5.
NRR vs GRR: expansion is the difference
Gross revenue retention (GRR) is the same formula with the upside removed: it excludes upsells, cross-sells and price increases, it can never exceed 100%, and 95% gross retention equals 5% churn4.
Net retention adds the positive effect of upsells to gross retention, so it is always higher than gross retention4. Because expansion only ever adds, NRR is never below GRR5. The two answer different questions. NRR asks whether revenue from existing customers is growing overall. GRR asks how much revenue would be kept with zero expansion5.
| NRR | GRR | |
|---|---|---|
| Counts expansion | Yes5 | No5 |
| Can exceed 100% | Yes5 | No4 |
| What it answers | Is revenue from existing customers growing?5 | How much revenue is kept with zero expansion?5 |
Stripe, a payments vendor, calls GRR the most honest indicator of long-term sustainability. That is a vendor’s view and not a standard, but the reason holds up: NRR can mask a retention problem if efforts to grow revenue among existing customers are especially successful6. A company can report a healthy NRR while it loses customers, so read the two together.
NRR vs MRR vs ARR: a ratio against run-rates
MRR and ARR record how much recurring revenue exists at a point in time. NRR records what happens to it over a period.
MRR is the predictable revenue a company expects every month from its active subscriptions5. ARR is the annual run-rate revenue of subscription agreements from all customers at a point in time, calculated by multiplying MRR by 12. Both are operating metrics, to be viewed independently of revenue and not as replacements or forecasts of it3.
So MRR and ARR are stocks, like a bank balance. NRR is a ratio of two such balances, taken from the same customers a year apart3. A company can have rising ARR and falling NRR when new customers are covering for losses in the old ones.
NRR is not revenue: where ASC 606 comes in
Revenue is defined by an accounting standard, not by a dashboard. Under ASC 606, the core principle is that an entity recognizes revenue to depict the transfer of promised goods or services to customers in an amount that reflects the consideration it expects to be entitled to7. Revenue is recognized when, or as, the entity satisfies a performance obligation by transferring a promised good or service to a customer7.
ARR and MRR work differently: they are run-rate figures that do not represent revenue under GAAP on a monthly or annualized basis3. NRR is a ratio built from them, so it inherits the gap. An upgrade signed in March raises March ARR and lifts NRR immediately, while the revenue from it is recognized as the service is delivered. That is why NRR will not reconcile to the revenue line in the income statement, and why it should sit in your reporting as an operating metric with its own definition, next to recognized revenue and never in place of it3, 7.
How public companies define it
There is no single required formula. The SEC’s 2020 guidance on key performance indicators asks that when a company discloses a metric like this, it should provide a clear definition of the metric and how it is calculated1. It should also state why the metric provides useful information to investors, and how management uses it to monitor the performance of the business1. If the method changes, the company should consider whether it is necessary to recast prior metrics1. That guidance took effect on February 25, 20201.
The result is that two large software companies can print a number called “net retention” that is built differently.
Snowflake uses a two-year window. It takes customers under capacity contracts that used the platform in the first month of the first year, and divides their product revenue in the second year by their product revenue in the first year2. A customer that stopped using the platform stays in the calculation and contributes zero revenue in the second year2. Its filing reports 125% and 126% as of January 31, 2026 and 2025, respectively2. Snowflake also expects the rate to decrease over the long term, as long-tenured customers become a larger share of the base2.
Datadog uses a trailing average. It starts with ARR from all customers as of 12 months earlier, then measures ARR from the same customers today, including expansion and net of contraction or attrition3. It excludes new customers3. It then averages the trailing 12-month point-in-time rates3. As of December 31, 2025 the rate was about 120%3, and the filing attributes the rise to increased usage growth from existing customers3.
Snowflake itself warns that the calculation of its key metrics may differ from similarly titled metrics at other companies, analysts or investors2. Before you compare your NRR with a public company’s, compare the recipe.
What counts as a good net revenue retention rate
A rate of 100% or more means a business is growing revenue from existing customers even after accounting for churn5. A rate above 100% generally indicates healthy levels of customer retention and revenue growth6. An NRR over 100% means a business can grow significantly even if it never signs a single new customer6.
Beyond 100%, “good” depends on who you are measured against. SaaS Capital’s advice is to benchmark by average contract value (ACV): companies that share a similar selling price have the most in common4. Higher net retention correlates with higher ACVs4.
Net revenue retention benchmarks
The published medians below come from different samples and should not be mixed.
| Source and sample | Figure |
|---|---|
| SaaS Capital 2025 survey, private B2B, ACV $25,000 to $50,000 | median 102%, top quartile 111%, lowest quartile 97%4 |
| ChartMogul analysis, December 2025, 3,500 software companies | median 82% for B2B SaaS, top quartile 97%5 |
| ChartMogul, consumer and AI-native products | median around 48-49%5 |
| Snowflake, public, as of January 31, 2026 | 125%2 |
| Datadog, public, as of December 31, 2025 | about 120%3 |
The gap between 102% and 82% is not a contradiction. The SaaS Capital figure covers one ACV band in a survey of private companies, while the ChartMogul figure covers a wide set of subscription businesses that use its software4, 5. SaaS Capital also notes that benchmarking against public SaaS companies is of limited usefulness for private ones4. Pick the benchmark whose price point matches yours, and say which one you used.
Why NRR is important to the business: retention compounds
Retention compounds. SaaS Capital calls revenue retention one of the most important metrics for medium- to long-term business health because of its compounding effect on growth, and the higher it is, the easier growth gets: a company does not have to refill the bucket before it adds to it4.
The data supports the link. In SaaS Capital’s sample of companies with more than $1 million in ARR, the median growth rate was 24%4. Groups with NRR of at least 110% grew faster than that median, and companies with NRR below 100% grew slower4. ChartMogul found that low-retention companies are three times as likely to be shrinking as they are to be growing quickly5.
For a board or an investor, NRR also shows where growth comes from. A high figure means a large share of next year’s revenue is already inside the customer base. A low one means new sales must replace losses before they add anything. Investors meet the figure in fundraising conversations as well as in board packages.
What can distort NRR
A single percentage hides several mechanisms, and some of them flatter it. Price increases are the quietest: NRR includes upsells, new product cross-sells and price increases, so a rise in the rate may come from pricing and not from customers using more4. Expansion can also hide churn. A high NRR can coexist with customers leaving, if a few large accounts grow enough to cover the losses6.
Age works the other way. Snowflake expects its rate to fall as long-tenured customers become a larger part of the base2, and a young cohort has more room to grow than an old one. Definitions matter as much as age. Window length, the treatment of resellers and averaging all change the result: Snowflake includes end-customers under reseller arrangements in its cohorts2, while Datadog takes a weighted average of the trailing 12-month point-in-time rates3. And when a company changes its method, prior periods may need to be recast so the series stays comparable1.
How to improve net revenue retention
Our suggested order is churn first, then expansion, then ownership. Reducing churn is a key way to improve net revenue retention5, and some churn is a mistake and not a decision: customers should not churn through expired cards or anything else that contributes to declined payments5.
Expansion comes next. Upsells and cross-sells are what lift NRR above GRR, and price increases count too, so report the two separately4. Someone also has to own the number. NRR is usually owned by the customer success leader, though any team that touches product, sales or customer support should be involved5.
Treat each tactic as a hypothesis and compare the cohorts before and after any change you make. If you can fix only one thing this quarter, fix the churn you can still see in the payment data.
Where NRR sits in a board package
An investor or director usually sees NRR next to growth and burn. Keep the definition in a footnote and keep it stable. The SEC’s guidance for public companies is a useful model for private ones: a clear definition, the reason the metric is useful, and how management uses it1. If you change the recipe, show the old and new method side by side for at least one period, as recasting prior periods does for a public company1. The funding side of that conversation is covered in how venture rounds work.
Read next
SaaS metrics
SaaS churn rate: formula, examples and benchmarks
Churn rate is the share of customers or recurring revenue lost in a period: the formulas, a worked example, benchmarks and how public filers define it.
SaaS metrics
ARR vs MRR: difference, formula and when to use each
MRR is recurring revenue per month and ARR is the annual figure, but ARR has two definitions. Formulas, a worked example, GAAP revenue and how filers define it.
SaaS metrics
CAC payback period: formula, example and benchmarks
CAC payback period is the months of gross profit a new customer needs to repay their acquisition cost: formula, worked example, benchmarks and filer recipes.
Sources
- Commission Guidance on Management's Discussion and Analysis (Release 33-10751): key performance indicators and metrics · U.S. Securities and Exchange Commission · sec.gov · checked October 21, 2026
- Snowflake Inc. Form 10-K for the fiscal year ended January 31, 2026 · Snowflake Inc. (SEC filing) · sec.gov · checked October 21, 2026
- Datadog, Inc. Form 10-K for the fiscal year ended December 31, 2025 · Datadog, Inc. (SEC filing) · sec.gov · checked October 21, 2026
- What is a Good Retention Rate for a Private SaaS Company in 2025? · SaaS Capital (annual survey, September 18, 2025) · saas-capital.com · checked October 21, 2026
- Net Revenue Retention (NRR) · ChartMogul (SaaS metrics library, updated September 8, 2026) · chartmogul.com · checked October 21, 2026
- Net revenue retention (NRR): What it is and why it matters for SaaS businesses · Stripe (last updated May 7, 2026) · stripe.com · checked October 21, 2026
- Revenue from Contracts with Customers (Topic 606), Accounting Standards Update · Financial Accounting Standards Board · storage.fasb.org · checked October 21, 2026
Published . Rules and rates change: each source shows the day it was read. Education only, not advice. How we check facts · Report an error.