Churn is the rate at which a business is losing customers or revenue through subscription cancellations1. The word hides two calculations that give different answers for the same company, and a third that can fall below zero. This page sets out each formula, runs them on one made-up company, lines up the published benchmarks with their sample and year, and shows how two public companies define churn in their annual reports. It belongs to SaaS metrics. The retention view of the same loss is net revenue retention, and the recurring-revenue base the percentages sit on is explained in ARR vs MRR.
What SaaS churn rate means
There are two kinds. Customer churn, also called logo churn, is the percentage of paying customers a SaaS business loses over a period1. Revenue churn is the percentage of recurring revenue lost to cancellations or downgrades within a period8. Net revenue churn then credits the revenue gained from customers who stay2. All three are ratios against the same starting point: what the business had at the beginning of the period.
| Customer churn | Gross revenue churn | Net revenue churn | |
|---|---|---|---|
| What it counts | Paying customers lost1 | Recurring revenue lost to churn and contraction2 | Revenue lost minus revenue gained from existing customers2 |
| Formula | (Customers churned − joined-and-churned − churned-and-reactivated) ÷ customers at start1 | (Churn + contraction MRR) ÷ MRR at start2 | (Churn and contraction MRR − expansion and reactivation MRR) ÷ MRR at start2 |
| Can it be negative | Not in this formula | No, by definition2 | Yes, and that is negative churn2 |
How to calculate churn rate in SaaS
The arithmetic is a single division. The care goes into what sits in the numerator and denominator.
- Choose the period and state it. Quarterly, monthly or annual all work, but the period has to be chosen, applied consistently and written next to the number9.
- Count the starting base. Count paying customers only: free trials and free-plan users are excluded1. Customers won during the period are not part of the base11.
- Count who left. Take the customers who churned, then remove those who both joined and churned in the period and those who churned and reactivated1.
- Divide and read it as a percentage. Customers lost over customers at the start of the period is the churn rate9.
Three published examples show the same division at different scales.
| Source | Starting base | Lost | Result |
|---|---|---|---|
| ChartMogul, monthly | 100 customers, of which 12 churn, one had joined that month and one reactivated, so (12 − 2)1 | 10 | 10%1 |
| ChurnZero, monthly | 900 existing customers, 50 new ones ignored11 | 30 | 3.33%11 |
| Wall Street Prep, annual | 200 customers at the start of the year9 | 8 did not renew | 4.0%9 |
The exclusions matter more than they look. A 30-day money-back guarantee lets customers try a product, and customers who use it do not necessarily belong in churn calculations1. Win-backs are a similar judgement: a business may count former customers who return within a set window, such as 12 to 24 months, as renewed customers11. Whatever the policy, write it down once and apply it to every period.
Worked example: one month of churn at Tidewater
Worked example (our arithmetic): Tidewater, one month (formulas from1 and2)
Tidewater is a made-up software company. All inputs are invented round numbers. The first table is the month’s ledger and the second applies the formulas.
| Line | Amount |
|---|---|
| Customers at start of month | 500 |
| Existing customers who cancelled | 10 |
| New customers won (left out of the base) | 40 |
| MRR at start of month | $75,000 |
| MRR lost to cancellations | $2,400 |
| MRR lost to downgrades | $600 |
| MRR gained from upgrades | $1,500 |
| Measure | Calculation | Result |
|---|---|---|
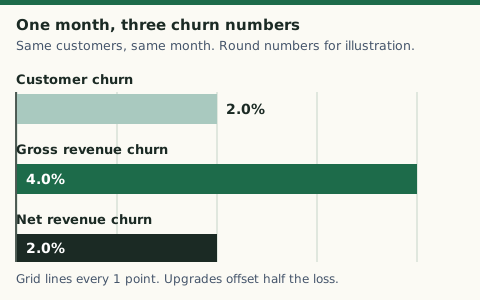
| Customer churn | 10 ÷ 500 | 2.0% |
| Gross revenue churn | ($2,400 + $600) ÷ $75,000 | 4.0% |
| Net revenue churn | ($2,400 + $600 − $1,500) ÷ $75,000 | 2.0% |
| Gross revenue retained over the month | 100% − 4.0% | 96.0% |
| Annualized customer churn | 1 − (1 − 0.02)^12 | 21.5% |
| Annualized gross revenue churn | 1 − (1 − 0.04)^12 | 38.7% |
The cancelled accounts paid $240 a month on average ($2,400 ÷ 10), against $150 for the whole base ($75,000 ÷ 500). That is why revenue churn runs above customer churn here. Upgrades then pay back half of it, which is how a 4.0% loss becomes a 2.0% net figure. A dashboard that showed only customer churn would call this a 2.0% month and miss that revenue left twice as fast.
Customer churn vs revenue churn: which to report
Report both, and read them together. ChartMogul’s three-customer case makes the point: customers A, B and C pay $20, $30 and $50 a month, so MRR is $1001. If C cancels, customer churn is 33% because one of three customers left, while revenue churn is 50%1. The two diverge whenever the churned accounts are not average-sized2. Lose a handful of the biggest accounts and revenue churn spikes while customer churn barely moves. Lose a long tail of small accounts and the opposite happens2.
ChurnZero’s example shows the same split on a larger base. With 900 customers and an average of $30 each, MRR is $27,000 at the start of the month11. The monthly churn rate by customer count is 3.33%, yet the MRR churn rate is 4.44% because the customers who left paid more than the average11. Vena’s finance-team view is that revenue churn is the more complete picture, since losing a single high-value client can hurt more than losing several small ones10. Customer churn is still the cleaner signal of product fit and customer experience10.
Gross, net and negative revenue churn
Gross revenue churn counts only what was lost. It is the churn plus contraction MRR divided by MRR at the start of the period2. It can never be negative2. Stripe’s example is the cleanest: a company with $100,000 of MRR at the end of January loses $5,000 in February to cancellations and downgrades, so gross revenue churn for February is 5%8.
Net revenue churn subtracts expansion as well. Using the same figures, if the company also gained $2,000 of expansion MRR in February, its net revenue churn would be 3%8. The formula divides churned MRR minus expansion MRR by MRR at the end of the previous month8. ChartMogul’s version also removes reactivation revenue in the numerator2.
When expansion outweighs losses the result goes below zero, and that is negative churn. It occurs when new revenue from the existing base, through expansions and reactivations, exceeds the revenue lost to cancellations and contractions in the same period1. Vena’s example has $500,000 of MRR at the start of a quarter, $30,000 lost to cancellations and downsells and $40,000 gained from upsells, so net revenue churn is −2%10. In that state the business would keep growing even with no new customers1.
Look at both lines every period. Focusing on the net number alone can hide reasons customers leave that a product or commercial team could fix2. The only sustainable route to negative churn that ChartMogul points to is an expansion loop built into the pricing model2.
What revenue churn can tell you about your business
A revenue churn number is a diagnosis, not just a score. It speaks to financial health: high churn erodes revenue and profitability and makes future income hard to predict8. It also works as a barometer for customer satisfaction and product-market fit8. Resource allocation follows from it, because revenue churn helps a company decide where to spend8. When churn is high, customer service, product improvement or retention programs might take priority over investing in acquisition8. Valuation is the last link: businesses with lower revenue churn are often valued higher, since stable revenue streams reduce investment risk8.
Monthly vs annual churn rate
Monthly and annual churn are not interchangeable by a factor of 12. The conversion is one minus the quantity (1 minus the monthly churn rate) raised to the 12th power9. The reason is compounding: each month’s loss comes out of a base that is already smaller.
Worked example (our arithmetic): monthly churn converted to annual (formula from9)
| Monthly churn | Times 12 | Compounded: 1 − (1 − monthly)^12 |
|---|---|---|
| 1% | 12% | 11.4% |
| 2% | 24% | 21.5% |
| 3% | 36% | 30.6% |
| 5% | 60% | 46.0% |
| 7% | 84% | 58.1% |
Multiplying by 12 overstates the annual loss, and the gap widens as the monthly rate rises. The reverse mistake is also common: quoting a monthly rate next to an annual benchmark. Peloton, for example, reports churn as a monthly average even in its annual filing4.
What is a good churn rate for a SaaS company?
There is no single good rate. It varies by company stage, category and price point1. Early-stage companies and lower-priced products typically see the highest churn1. ChartMogul’s 2025 analysis of 3,500 software companies found the price effect is dramatic: products selling above $250 a month retain at rates matching classic B2B SaaS, while products under $50 a month retain 20 or more points worse than either B2B or B2C SaaS1. Benchmarks also disagree because their samples differ, so read the sample before the number.
| Source and sample | Figure |
|---|---|
| Vena summary of Recurly and Paddle 2025 data: B2B SaaS, overall | 0.3%–1% a month, 3.5%–5% a year10 |
| Same source: SMB SaaS | 3%–7% a month, 30%–58% a year10 |
| Recurly study, as cited by Vena: median overall churn | 3.27% a year10 |
| ChurnZero rule of thumb: SaaS in general | Monthly below 2%, or annual under 10%, is considered strong11 |
| ChartMogul: median customer churn, companies with net revenue retention at or above 100% | 1.7% (quartiles 0.9% to 3.2%)1 |
| ChartMogul: median customer churn, companies with net revenue retention below 60% | 7.3% (quartiles 5.5% to 10.5%)1 |
| ChartMogul: best-in-class gross revenue retention, any stage | Over 86%, so about 14% of gross revenue lost in a year3 |
A few patterns in the same data are worth keeping. Companies in the low net-retention band have more than four times the median customer churn of those at or above 100%1. Churn is also U-shaped against growth: median churn is highest at both extremes, 5.2% for shrinking companies and 5.3% for companies growing over 100% a year, and lowest, 3.1% to 3.5%, for growth between 0% and 100%1. Hyper-growth often brings customers who sign up in a burst and leave within months1. And churn usually settles as a company matures, although survivorship bias may be part of that9.
Price point also moves gross retention. The top quartile of companies with revenue per account above $500 a month reaches about 88% gross retention, while the top quartile of those below $50 a month only reaches 60% to 70%3. The editors’ reading: take the benchmark that matches what you sell. A product under $50 a month and one above $250 a month are different businesses1, and mixing their churn rates produces a target that neither can use. The same logic is why SaaS Capital groups its survey by contract value6.
Churn vs retention: GRR and NRR
Churn and retention are two views of one loss. Churn is usually best described as one minus gross retention, so 95% gross retention equals 5% churn6. Gross revenue retention (GRR) excludes upsells, cross-sells and price increases, which is why it cannot exceed 100%6. Net retention adds the upsells back, so it is always higher than gross retention6.
ChartMogul’s GRR example has four paying customers with a total MRR of $770 a year ago3. Excluding expansion, the same group pays $630 today, so GRR is 81.8%3. That business kept 81.8% of its starting revenue from churn and downgrades alone3. The two ratios can tell opposite stories: a business with 70% GRR and 115% NRR has a real retention problem that a good expansion motion is currently covering for3. The full treatment of the net version is on the net revenue retention page.
Retention can be measured over any period, but 12 months is the common window3. Churn is also easier to compare when the calculation follows a cohort over time for consistency6.
How public companies define churn
Two annual reports show how much room there is inside one word. The SEC’s guidance on key performance indicators asks a company to give a clear definition of the metric and how it is calculated7. It also asks for a statement of why the metric gives useful information to investors7. When the method changes, the guidance points to recasting earlier figures where needed so that the new disclosure is read in context7.
| Peloton | HubSpot | |
|---|---|---|
| Metric | Average Net Monthly Paid Connected Fitness Subscription Churn4 | Net Revenue Retention5 |
| What it measures | Subscribers lost per month4 | Percentage of recurring revenue retained from customers over a period5 |
| Numerator | Churn events minus unpause events minus reactivations4 | Retained subscription revenue5 |
| Base | Average number of beginning paid subscribers each month4 | Contractual monthly subscription revenue at the beginning of each month5 |
| Averaging | The monthly percentages averaged across the quarter4 | Weighted average of the monthly rates, then annualized5 |
| Latest figure | 1.7% for the fiscal year ended June 30, 2026, against 1.6% and 1.4% in the two prior years4 | Calculation adjusted in 2025; 102.2% in 2024 and 103.9% in 2023 under the previous method5 |
Peloton’s 10-K treats any cancellation or pausing of a subscription as a churn event4. A paused subscription counts as churn when the pause takes effect at the start of the next billing cycle, because the company is not paid during the pause4. A pause that ends without cancellation is netted out as an unpause4. The company also moved its subscription data to a new model that gives more precise data on pause and churn behavior, and revised prior periods to match4. It stopped reporting its app-subscription churn metric from fiscal 20264.
HubSpot’s 10-K reports retention rather than churn, which is the mirror image. Its net revenue retention is calculated by dividing retained subscription revenue by the retention base revenue, weighting the monthly rates by base revenue, and annualizing them5. Customers are counted as business entities with one or more paid subscriptions5. Two lessons carry over to a private company. A definition can change, and the old and new series then need a label5, 7. And one company’s monthly churn is not another’s: Peloton nets reactivations and counts pauses, which a simple cancellations-over-start formula would not4.
Why customers churn
Customers leave primarily because they do not see value in the product1. Churn comes in several kinds, and each needs a different fix. Voluntary churn is a customer deciding to cancel. Passive churn, sometimes called delinquent churn, happens when a customer forgets to update credit card details1. ChartMogul has seen it account for as much as a third of all churn, and has seen companies recover a large proportion of it through simple dunning campaigns1. Wall Street Prep lists the same cause as involuntary cancellation: a card decline, a network failure or an internal mistake9.
Timing is diagnostic. If churn is very high in the first or second month, the customer did not reach the point where the product’s value shows, and onboarding is the place to step in1. A cohort analysis shows how churn evolves across the lifetime of a group of customers who converted in the same period, usually a month1. Contract structure matters too. Most B2B sales are multi-year contracts instead of monthly ones, so B2B customers carry more contractual obligation to stay9.
How to reduce churn rate
Test each of these against your own cohorts before betting on it.
- Fix onboarding first. A comprehensive onboarding process helps customers understand how to use the product from the start, which supports satisfaction and can reduce churn8.
- Recover failed payments. Expired cards and failed payments quietly erode retention, and customers often do not realize a subscription has lapsed3.
- Track downgrades like cancellations. Every seat removed or plan stepped down is lost gross retention, because GRR excludes expansion yet counts every dollar of contraction3.
- Offer a cheaper tier before a cancellation. Customers sometimes churn because they feel they are not getting enough value from their pricing tier, or find the product too expensive8.
- Fix leaks before chasing expansion. A company that pours resources into upsells while ignoring a weak GRR builds growth on a leaky foundation3.
- Segment by cohort. Segmenting retention by cohort, plan or acquisition channel shows when in the lifecycle revenue disappears, and the fix differs between an onboarding problem and a pricing problem3.
Retention carries more weight than it looks. The effect compounds: the higher the retention, the easier it is to grow faster, because there is no need to refill the bucket before adding to it6. Wall Street Prep makes the cost side explicit: acquiring new customers is futile if a company cannot retain them9.
Churn, customer lifetime and LTV/CAC
Churn feeds the lifetime half of the LTV/CAC ratio. Wall Street Prep estimates customer lifetime as 1 divided by the churn rate, so a monthly churn rate of 2.0% implies a lifetime of 50 months9. The ratio itself compares the value obtained from a customer with the cost of acquiring that customer9. Valuation follows retention too: businesses with lower revenue churn are often valued higher than those with higher churn8.
Worked example (our arithmetic): the same formula on Tidewater’s two churn rates (formula from9)
| Rate | Calculation | Implied lifetime |
|---|---|---|
| Customer churn, 2.0% a month | 1 ÷ 0.02 | 50 months |
| Gross revenue churn, 4.0% a month | 1 ÷ 0.04 | 25 months |
How quickly the acquisition cost comes back is a separate question, covered in CAC payback period, and what a high churn rate does to cash is the subject of burn rate and runway. The two lifetimes differ by a factor of two, and which one belongs in LTV depends on what LTV measures. A customer-count lifetime suits a per-customer average. A revenue-weighted figure suits a calculation built on dollars. Using the customer figure for large accounts overstates how long their revenue stays.
Common mistakes
- Counting new customers in the base. The base is what existed at the start of the period11.
- Counting free users. Free trials and free-plan users are excluded from paying-customer churn1.
- Quoting the rate without the period. The period has to be chosen, applied consistently and stated9.
- Annualizing by multiplying. The conversion is compounded, not times 129.
- Comparing against the wrong sample. Medians run from 1.7% to 7.3% a month across net-retention bands, so a benchmark from another price point misleads1.
- Watching only customer churn. A handful of high-value cancellations can hurt revenue far more than the count suggests1.
- Changing the definition silently. The SEC asks filers to consider recasting earlier figures when the method changes7.
Common questions
Is a 5% churn rate good?
It depends on the period. A 5% annual rate sits at the top of the range Vena reports for B2B SaaS, 3.5%–5% a year10. A 5% monthly rate is inside the SMB band of 3%–7% a month and is sometimes cited as acceptable, but it can give a false sense of security9, 10. State the period first, then compare with companies that sell at your price.
Read next
SaaS metrics
Net revenue retention: formula, example, benchmarks
Net revenue retention measures how much recurring revenue a customer group still pays a year later: the formula, a worked example, GRR, ARR and benchmarks.
SaaS metrics
ARR vs MRR: difference, formula and when to use each
MRR is recurring revenue per month and ARR is the annual figure, but ARR has two definitions. Formulas, a worked example, GAAP revenue and how filers define it.
Fundraising mechanics
How venture rounds work: seed to exit, step by step
How a startup funding round works: who invests at each stage, SAFEs and convertible notes, the Series A paperwork, investor rights and the ways a company exits.
Sources
- Customer churn rate · ChartMogul (SaaS metrics library, updated September 8, 2026) · chartmogul.com · checked October 21, 2026
- Revenue churn · ChartMogul (SaaS metrics library) · chartmogul.com · checked October 21, 2026
- Gross Revenue Retention (GRR) · ChartMogul (SaaS metrics library, updated September 8, 2026) · chartmogul.com · checked October 21, 2026
- Peloton Interactive, Inc. Form 10-K for the fiscal year ended June 30, 2026 · Peloton Interactive, Inc. (SEC filing) · sec.gov · checked October 21, 2026
- HubSpot, Inc. Form 10-K for the fiscal year ended December 31, 2025 · HubSpot, Inc. (SEC filing) · sec.gov · checked October 21, 2026
- What is a Good Retention Rate for a Private SaaS Company in 2025? · SaaS Capital (annual survey, September 18, 2025) · saas-capital.com · checked October 21, 2026
- Commission Guidance on Management's Discussion and Analysis (Release 33-10751): key performance indicators and metrics · U.S. Securities and Exchange Commission · sec.gov · checked October 21, 2026
- Revenue churn rate explained · Stripe · stripe.com · checked October 21, 2026
- Churn Rate | Formula + Calculator · Wall Street Prep · wallstreetprep.com · checked October 21, 2026
- 2025 SaaS Churn Rate: Benchmarks, Formulas and Tips · Vena Solutions (cites Recurly and Paddle 2025 data) · venasolutions.com · checked October 21, 2026
- Churn Rate: How to Calculate and Examples · ChurnZero · churnzero.com · checked October 21, 2026
- Rule of 40 · ChartMogul (SaaS metrics library) · chartmogul.com · checked October 21, 2026
Published . Rules and rates change: each source shows the day it was read. Education only, not advice. How we check facts · Report an error.