Tern, a made-up software company, ended its quarter with annual recurring revenue up and a finance lead who had to explain why. The first draft was a spreadsheet: every customer, every month, every adjustment. Each cell was right, and nobody in the room could say what the quarter meant. The second draft was one chart and three sentences, and the board spent its time deciding what to do about it.
That difference is the subject of this page. It defines the practice, shows a structure, works one example with the arithmetic in view, and covers the part that keeps a story honest. It sits in the metrics section, next to the definitions the stories are built from: net revenue retention, ARR versus MRR and churn.
What data storytelling means in finance
Data storytelling means presenting data in a way that is memorable and easy to digest1. In finance it works alongside budgeting, forecasting and financial reporting, supplying the context and reasoning behind the numbers1. The reference definition is the same idea from the visualization side: charts and tables paired with a narrative structure, to contextualize the analyzed data9.
A story is not a simplification. The SEC’s Plain English Handbook is direct on this point: plain English does not mean deleting complex information to make the document easier to understand2. It means deciding what information the reader needs to make informed decisions before any words, sentences or paragraphs are chosen2. In a board deck the detail stays available; what changes is the order, and the order is the story.
Two sentences with the same figure show the gap. The first reports it, and the second explains it3.
| Version | Sentence |
|---|---|
| Data | Operating expenses rose 17% year-on-year3 |
| Story | Our operating expenses rose 17% because supply chain delays forced us into higher-cost suppliers, but we can reverse this trend within one quarter by renegotiating contracts already in progress3 |
The second version names a cause, a direction and a timeframe. The reader can agree, disagree or ask a better question, which a bare percentage does not allow.
Why a spreadsheet alone fails
The usual failure is not wrong numbers. A training vendor lists three reasons most financial presentations fail: they dump data without explaining the meaning, they overload the audience with details, and they lack emotion and structure3. Each of the three is a decision the presenter made, and each can be reversed.
Practitioners rate the difficulty the same way. In an FP&A Trends session on storytelling, 37% of the audience picked structuring the story as the biggest challenge, 30% engaging the audience and 26% simplifying complex topics4. That is a self-selected poll of people who chose to attend a storytelling session, so it shows what practitioners find hard, not what finance teams in general do. In the same poll, 36% said they always apply storytelling in presentations, 30% often, 33% sometimes and 2% never4.
One speaker at that session cited surveys, without naming them, that only around 30% of finance professionals feel confident in their storytelling abilities, a 70% skills gap, and that 76% of CFOs believe finance teams need to improve4. Treat these as a signal rather than a measurement: the underlying surveys are not identified. The direction is consistent with what the other sources describe, which is that the skill is treated as optional until a presentation fails.
Three structures finance teams use
Most frameworks have three parts, and they are variations on one move: say the point, explain it, ask for a decision.
| Framework | Parts | Source |
|---|---|---|
| Three Ts (Deloitte) | Takeoff: open with the most critical insight and tailor the hook to the audience. Turbulence: explain what happened, the margin impact and what management is doing differently. Touchdown: close with a call to action5 | Deloitte CFO Insights |
| Context, insight, action | Why the audience should care; what the number means beyond what happened; what to do next3 | Redcliffe Training |
| Top-down for non-finance audiences | The most significant information first, then a layer of detail, then examples and case studies1 | Vena |
Deloitte adds a second layer for making the story stick: details, dialogue and drama, used to create vivid, credible moments people remember5. For a finance team the practical translation is a named customer, a real conversation with the operator behind the number, and the one risk that would change the plan.
Two limits keep the structure usable. Limit key takeaways to three points, delivered at a pace that allows for reflection4, because a presentation fails when it includes too much detail and the audience cannot take anything away4. And lead with the headline, not the methodology3; the method belongs in an appendix for anyone who wants it, since the urge to include every detail only muddies the message1.
Worked example (our arithmetic): one bridge, two headlines
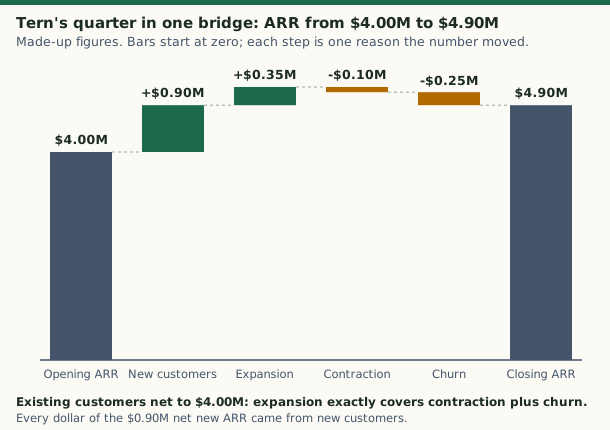
Tern’s quarter, with made-up figures in thousands of dollars. This is the bridge from opening to closing annual recurring revenue (ARR), which is the usual place a finance story starts.
Worked example (our arithmetic): Tern’s quarterly ARR bridge
| Step | $ thousands |
|---|---|
| Opening ARR | 4,000 |
| New customers | +900 |
| Expansion from existing customers | +350 |
| Contraction | -100 |
| Churn | -250 |
| Closing ARR: 4,000 + 900 + 350 - 100 - 250 | 4,900 |
| Net new ARR: 4,900 - 4,000 | 900 |
| ARR growth: 900 ÷ 4,000 | 22.5% |
| Existing customers: 4,000 + 350 - 100 - 250 | 4,000 |
| Net revenue retention: 4,000 ÷ 4,000 | 100% |
The data headline is “ARR grew 22.5%.” It is true and it hides the shape of the quarter. The story headline is that ARR grew 22.5% to $4.9 million, every dollar of it from new customers, because expansion only offset contraction and churn. That second headline turns a number into a question: what is making customers leave, and is the new-customer engine cheap enough to keep outrunning it? Metrics such as net revenue retention and churn have exact definitions on their own pages, and the story only works if they are used the way those pages define them.
Mapped to Deloitte’s structure, the takeoff is the 22.5% with the 100% beside it. The turbulence is the churn and contraction lines and what the company is changing. The touchdown is the one decision the board is asked to make5. The figure on this page draws the same table as a waterfall, so the eye can follow the running total.
From visualization to storytelling
A chart is not a story until it makes one point. Three time series can share the same total and the same average and still tell three different stories once drawn: one customer’s transactions climb steadily, another’s spike, a third’s rise and fall6. Each shape suggests a different action for a different team, a marketing follow-up for the decline and a compliance look at the spike6. Exploration finds the pattern; explanation then has to draw the audience to it.
For explanatory visuals the test is stated plainly: draw the audience to the core insight, convey a narrative supported by the data, give context and reveal actionable insights6. That usually means leaving things out. Good practice omits chart junk, such as extraneous lines and labels, and visual clutter, such as varying colors or shapes, that would distract from the message6. Design and function have to combine, and nothing should be mere decoration1.
Choose the chart by the question:
- Waterfall (bridge). A waterfall chart is a form of data visualization that helps in understanding the cumulative effect of sequentially introduced positive or negative values7. In finance it displays how a net value is arrived at through gains and losses over time or between actual and budgeted amounts7, and it is often used to show changes in revenue or profit between two time periods7.
- Line. Revenue plotted against operating cost over several quarters: if revenue ascends while cost stays flat or declines, the line itself is the evidence of improving efficiency1.
- Headline above the chart. Never make people interpret a chart on their own; write a short headline that states the insight3.
The classic argument for pictures is the Minard diagram of Napoleon’s army. It plots six variables, namely the size of the army, its location on two axes, time, direction and temperature9, and tells a story that can be grasped immediately while identifying the source data to build credibility9. Finance charts rarely need six variables. The principle carries over: the source data stays visible, and the shape makes the claim.
Popular data visualization tools for finance
The tools sit in three groups. Licensed business-intelligence software includes Tableau and Microsoft Power BI, and custom dashboards are built in open-source languages such as Python, R and Javascript6. The third group is the reporting that ships inside other business software, which is what most finance teams already have.
The tool is the smaller decision. A common failure is a dashboard with numerous charts and filters but no clear objective or message6. A BI tool should serve as a storyboard where visual elements build a clear narrative, not as a place to park unrelated charts6. Formal reporting is often static, delivered in spreadsheets or slides based on long-established templates6, which leaves little room for a narrative; adding a headline line and one agreed annotation to the template is a cheaper fix than a new tool.
Storytelling also does not have to mean slides. A short Teams message or a well-written email can carry a powerful narrative4.
Good examples of data storytelling
Three of these come from practitioners, and two from a training vendor’s illustrations, which are scenarios and not audited case studies.
- A forecast with a narrative layer. A media company’s finance team built a rolling 12-month forecast with technology and procurement owners, grounded in real drivers such as contract terms and renewal timelines4. Each update came with a short story: what changed, why it mattered and what actions should follow4. A flagged spike in compute usage led to early contract renegotiations and budget savings4.
- A waterfall for non-finance readers. An FP&A director working with 60 regional fleet managers, experts in operations but unused to financial reports4, used an illustrative operating-profit variance to connect operational metrics, such as 12 unfilled positions or 30% excess overtime, to financial impact step by step4.
- A bad-news headline. A vendor scenario opens a board discussion of a cash gap with the figure and the fix in one line: a potential cash shortfall of £420,000 in Q43. The presenter then offers three options with different trade-offs, a recommendation and a decision3.
- A question that reframes the report. In another vendor scenario the analyst quantifies the potential impact of churn at £1.8 million in recovered annual revenue, with a visual, a benchmark comparison and recommendations3.
In all four the pattern is the same: one message, a cause, an action. Comparison does the rest, since a figure such as £2.3 million is neither good nor bad until it is compared with last year, the budget, competitors or industry benchmarks3.
Telling the story to people outside finance
Write with a specific person in mind2. The preface to the Plain English Handbook models the habit: write the annual report as if talking to relatives who are highly intelligent but not experts in accounting or finance, who understand plain English while jargon may puzzle them2. A plain English document uses words economically and at a level the audience can understand2.
For a mixed audience, top-down works: significant information first, then detail, then examples1. Answer the “so what?” for each finding1, highlight final takeaways and recommendations1, and pose questions about the data to invite two-way discussion1. Expect different teams to care about different measures, because one objective or KPI is not necessarily going to work for other teams1.
Keep the story honest: define every metric
A good story can mislead if the metric underneath it moves. For public companies, the management’s discussion and analysis section exists to provide material information relevant to an assessment of the financial condition and results of operations10, under Item 303 of Regulation S-K. SEC guidance on key performance indicators in that section took effect on February 25, 20208. It binds filers, not startups, but its checklist is a useful standard for any board deck. The Commission’s release generally expects a metric to come with three disclosures: a clear definition and how it is calculated, why it provides useful information, and how management uses it to manage or monitor the business8.
When the method changes, say so. A company that changes how it calculates or presents a metric from one period to another should consider disclosing the difference8. Controls matter too: effective controls and procedures are important when disclosing material key performance indicators derived from the company’s own information8. For a startup that means one definition of ARR, one of churn, one owner, written down once and reused in every report. The board reporting page shows where those definitions sit in a finance package.
Common questions
If this left you with a question, start with Net revenue retention: formula, example, benchmarks or ARR vs MRR: difference, formula and when to use each.
Sources
- What Is Data Storytelling: The Art of Communicating Financial Data to a Non-Finance Audience · Vena · venasolutions.com · checked October 22, 2026
- A Plain English Handbook · U.S. Securities and Exchange Commission · sec.gov · checked October 22, 2026
- Storytelling in Finance: How to Turn Numbers and Data Into Narratives That Get Results · Redcliffe Training · redcliffetraining.com · checked October 22, 2026
- The Story behind the Spreadsheet: Elevating FP&A Through Storytelling · FP&A Trends · fpa-trends.com · checked October 22, 2026
- CFO Insights: Storytelling with Data · Deloitte · deloitte.com · checked October 22, 2026
- Data Visualization and Storytelling in Finance · Data Society · datasociety.com · checked October 22, 2026
- Waterfall chart · Wikipedia · en.wikipedia.org · checked October 22, 2026
- Commission Guidance on Management's Discussion and Analysis of Financial Condition and Results of Operations (Release 33-10751) · U.S. Securities and Exchange Commission · sec.gov · checked October 22, 2026
- Data and information visualization · Wikipedia · en.wikipedia.org · checked October 22, 2026
- 17 CFR 229.303, (Item 303) Management's discussion and analysis of financial condition and results of operations · eCFR (U.S. Securities and Exchange Commission rule) · ecfr.gov · checked October 22, 2026
Published . Rules and rates change: each source shows the day it was read. Education only, not advice. How we check facts · Report an error.