On this page
- What goes in a board financial package: statements and KPIs
- KPIs: keep the list short and the definitions fixed
- Revenue recognition: why it matters for the deck
- Burn and runway: the page every board checks
- Budget versus actual: the variance section
- The narrative and the executive summary
- What changes by stage
- Timing, cadence and length
- How the close feeds the package
- Why accuracy matters beyond the meeting
- Worked example: Fernwood’s third-quarter package
- Common mistakes
A board package is read before the meeting, usually by people who sit on several boards, so the pages that matter are the ones that survive a fast read. This page lists what belongs in the financial section of a startup board package, what each part is for, how it changes by stage, and how one set of numbers flows from budget to board. It belongs to board governance and relies on two neighbours: the budget the package compares against, in startup annual budget, and the cash view, in burn rate and runway.
What goes in a board financial package: statements and KPIs
A credible package has two layers: the core financial statements, and a short, consistent set of KPIs on top of them1. The table lists each part, the question it answers for a director, and the sources that name it.
| Part | The director’s question | What to show | Source |
|---|---|---|---|
| Profit and loss (P&L) | Did we earn or lose money, and against plan? | Monthly and year-to-date, ideally compared against budget | 1 |
| Balance sheet | What do we own and owe? | Especially cash, deferred revenue and any debt | 1 |
| Cash flow statement | Where did cash actually move? | Often tells a different story than the P&L when deferred revenue or large receivables are in play | 1 |
| KPIs | Is the business healthy? | A short set: revenue, burn, runway and 3-5 business-specific metrics | 1 |
| Burn and runway | How long do we last? | Gross burn, net burn, months of cash, base and downside | 1, 3 |
| Variance to plan | Where did we miss, and why? | Budget, actual, gap, reason, response | 1 |
| Headcount | What is the biggest cost lever doing? | A running headcount report at all stages | 2 |
| Narrative | What should we conclude? | One paragraph, plus context beside any KPI that moved | 1 |
At a minimum, every early-stage startup board should receive reports on cash runway, headcount and the three core statements2. Once the company has revenue, add revenue growth, performance against plan and business-specific KPIs2. By Series A, the package should add a KPI dashboard, budget-versus-actual analysis, updated forecasts and waterfall reports2.
The three statements, in plain terms
The balance sheet is a snapshot of the business’s financials, in the SBA’s finance guide4. The P&L covers a period. The cash flow statement tracks the movement of cash. Together they answer different questions, which is the reason none of them substitutes for the others: Kruze points out that the cash flow statement often tells a different story than the P&L1, and Median adds that many seed-stage founders skip the cash flow statement and rely on the P&L alone, a habit it advises against because cash-basis profit and loss figures can mask real cash dynamics3.
Accrual or cash, and what GAAP has to do with it
Every figure in the package rests on an accounting method. Under the accrual method, transactions go on the books immediately upon completing the sale, while under the cash method a sale is recorded only once payment is received4. The SBA’s example: a sale made in January and paid in February lands on January’s books under accrual accounting and February’s under cash accounting4.
Generally accepted accounting principles (GAAP) standardize financial reporting using the accrual method, and FASB maintains GAAP in the United States4. Private companies are not required to follow GAAP4. A board does not need audited statements to read a package, but it does need one basis used consistently: Median’s warning is that cash-basis and accrual-basis numbers tell different stories, so a P&L on accrual with burn quoted on cash will not reconcile3.
KPIs: keep the list short and the definitions fixed
Kruze recommends a short list, consistent from meeting to meeting1. Redefining metrics or reshuffling the deck every quarter signals operational immaturity1. Common choices are ARR and MRR growth, gross margin, net revenue retention, CAC and burn multiple1. Median’s seed-stage list is 4-6 metrics: MRR, churn, CAC, the LTV-to-CAC ratio, headcount and pipeline3. For software companies, Burkland recommends emphasizing ARR and splitting its growth into new business, expansion, contraction and churn2. The definitions behind those lines are on this site: ARR vs MRR, net revenue retention and SaaS churn rate.
A private company reporting to a board is not bound by the SEC, but the SEC’s guidance on key performance indicators for public companies is a good checklist for any metric. For a metric presented to investors, it expects a clear definition of the metric and how it is calculated5. It also expects a statement of how management uses the metric to manage or monitor the business5. When the calculation method changes between periods, the company should consider disclosing the differences, and whether to recast prior metrics to match the current presentation5. Applied to a board deck, that means a one-line definition under each KPI, and a restated history when a definition changes.
A KPI with no reference point is not information
Burkland’s critique of a standalone dashboard is the practical test: a bookings figure means nothing until it is set against what was expected and against recent quarters2. When appropriate, compare presented numbers to projected targets and historical performance to provide meaningful context2. Burkland also warns against cherry-picking: choose a consistent format and do not cherry-pick data2.
Revenue recognition: why it matters for the deck
ARR and MRR are not revenue in the accounting sense, so the package should say how they connect. Kruze’s close checklist includes revenue recognized on an accrual basis and applied consistently, so the ARR or MRR shown to the board matches the revenue policy the accountant used to build the statements1. A board that notices inconsistent revenue treatment starts to question the other numbers1. The related rules are covered in ARR vs MRR.
Burn and runway: the page every board checks
Burn and runway belong on one page, updated every month1. Gross burn is the total cash spent in the period, regardless of revenue1. Net burn is cash spent minus cash collected, and it is the number that determines runway1. Runway is months of cash remaining at the current net burn, ideally shown both at the current run rate and under a downside scenario1.
Median adds two practices. Show a rolling 3-month average beside the latest month, to smooth one-off swings3. And show runway under a base case and a conservative scenario3. Burkland ties the page to fundraising: the timing of the next anticipated raise has to match the expected attainment of the milestones that justify it2. Burn rate and runway works through the arithmetic.
How a lender reads the same page
A venture lender’s 10-K shows what a professional reader looks for. TriplePoint looks for a balanced financial condition, typically 12 months or more of operating cash runway based on projected cash burn, or a path to profitability over a three- to five-year period6. Its quarterly reviews cover the timing and status of the next equity round, cash balance and burn rate, financial and operational progress and covenant adherence6. A board package that answers those four topics answers a lender’s questions too.
Budget versus actual: the variance section
A variance section sets actuals next to the budget the board already approved, as its own section and not an afterthought1. Lucid also frames it that way: comparing actual results to the board-approved budget helps frame the changes12. Kruze gives three parts1.
- The numbers. Budget, actual, and the dollar and percentage variance, by major P&L line and by department1.
- The explanation. A short, specific reason for any material variance1.
- The response. What management is doing about it: adjusting the forecast, reallocating spend, or deciding the variance is fine1.
Kruze’s example of a good explanation: cloud spend ran 18% over plan because usage grew faster than modeled, which beats “expenses were higher than expected”1. Boards expect plans to be wrong by some margin; what builds credibility is understanding the gap1. And a variance needs a plan to be a variance from, which is why the annual budget comes first1.
Two thresholds appear in the sources, and they are different tools. Median defines significant as more than 10% off plan, or anything the board might ask about3. Mercury’s internal escalation rule is that department owners manage variances under 5-10% without escalation, while anything above 10%, or any unplanned expense that affects runway, is escalated10. The first decides what goes in the deck, and the second decides who handles it before the deck.
Burkland adds the waterfall: a schedule that tracks monthly or quarterly performance and forecast movements over time, useful for ARR, revenue, expenses and cash2. Tables are often ideal for budget-versus-actual2.
The narrative and the executive summary
Boards receive a monthly update between meetings in most venture-backed startups, so the raw metrics are not new when the deck arrives1. What the deck adds is context. Kruze recommends a one-paragraph summary at the top of the financial section, context beside any KPI that moved meaningfully, and an explicit link from the numbers to the decisions on the agenda1.
ImBoard offers a structure for the executive summary, the 3-3-3 framework: three things going well, with metrics, three challenges with the proposed response, and three decisions or inputs needed from the board11. The same source suggests applying a newspaper test to every section: if it would not make the front page of the company’s internal news, it belongs in an appendix11. Both are practitioner heuristics, not rules, but they target the same failure: a pack nobody can skim.
What changes by stage
| Stage | What the sources add | Source |
|---|---|---|
| Pre-revenue and early | Cash runway, headcount and the three statements | 2 |
| Seed | A simple two-page P&L summary is enough; 4-6 metrics | 3 |
| Revenue stage | Revenue growth, performance versus plan, business-specific KPIs | 2 |
| Series A | KPI dashboard, budget versus actual, updated forecasts, waterfalls; P&L by department; a 90-day rolling forecast | 2, 3 |
By Series A, boards expect the income statement broken into departments or cost centers, with line-item visibility into headcount costs3. The expense lines should ideally be segmented between R&D, G&A and S&M, which requires the accounting system to be set up to break out department expenses2. Headcount is a key report because people costs are the most significant expense category for many startups2. It is not part of the accounting records in common bookkeeping systems, so most early-stage companies track it by hand and keep the history2.
Timing, cadence and length
Most venture-backed startups send a monthly investor update and hold a formal board meeting with a full deck quarterly1. Median sets 48 hours as the minimum for the package before the meeting3. Burkland and Lucid both recommend at least two days2, 12. Median sizes the package: for most seed and Series A startups, 8-15 pages covers everything, with the financial section typically 4-6 pages3. ImBoard sets a ceiling of 30 pages11. All of these are practitioner rules of thumb, and none comes from a regulator.
Preparation time is a signal. Median reports board prep cycles at most startups of three to ten business days, and treats more than two days of preparation as a symptom of weak financial systems3. Kruze reaches the same conclusion from the other side: the strongest packages are a by-product of a clean monthly close1.
How the close feeds the package
A close that feeds the package includes reconciled bank and card accounts, accrual-basis revenue applied consistently, actuals compared with budget every month and KPIs calculated the same way from the same data1. Median’s fix for mismatched figures between slides is a single source of truth: one model, one set of numbers, one review pass before the deck goes out3. Lucid adds a quality standard, the four Cs: correct, current, complete and consistent12.
Why accuracy matters beyond the meeting
Under Delaware law, the business and affairs of a corporation are managed by or under the direction of its board8. Directors are fully protected in relying in good faith on the records of the corporation and on information, reports or statements presented by its officers or employees, and on experts in matters the director reasonably believes are within their competence8. That is the statutory backdrop to the package: the board relies on what management presents. ImBoard makes the practical link, that a pack creates a record of what information directors had when making decisions11. This page explains the point and is not legal advice; counsel confirms how it applies to a given company.
The same package supports an accounting test. Under FASB’s going-concern update, management evaluates in each annual and interim reporting period whether conditions or events raise substantial doubt about the company’s ability to continue as a going concern within one year after the statements are issued7. Substantial doubt exists when it is probable the company will be unable to meet its obligations as they become due within that year7. A runway page that shows months of cash under a downside case is the working input to that look-ahead.
Worked example: Fernwood’s third-quarter package
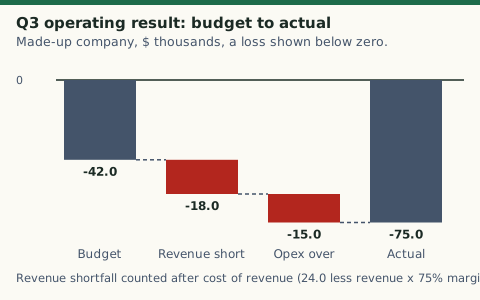
Worked example (our arithmetic): Fernwood’s Q3 budget versus actual (variance parts from1; figures continue the made-up company in startup annual budget: revenue is the sum of each month’s recurring revenue, cost of revenue is 25% of revenue, operating expenses are the $2,760,000 annual plan spread evenly over four quarters)
| Line | Budget | Actual | Variance | % |
|---|---|---|---|---|
| Revenue | $864,000 | $840,000 | −$24,000 | −2.8% |
| Cost of revenue | $216,000 | $210,000 | +$6,000 lower | |
| Gross profit | $648,000 | $630,000 | −$18,000 | −2.8% |
| Operating expenses | $690,000 | $705,000 | −$15,000 | 2.2% over |
| Operating income | −$42,000 | −$75,000 | −$33,000 | worse by 78.6% |
The revenue variance traces to recurring revenue: plan assumed net new MRR of $11,000 a month ($12,000 new, $2,000 expansion, $3,000 churn), while actual net new was $7,000 a month (new $9,000, expansion $2,000, churn $4,000). MRR at the end of the quarter was $287,000 against a plan of $299,000, so year-end ARR run rate is $3,444,000 against a plan of $3,588,000.
Worked example (our arithmetic): Fernwood’s runway page (net burn and runway formulas from1; cash is treated as equal to the operating result, a simplification; cash at September 30 is a made-up input)
| Base case | Downside | |
|---|---|---|
| Quarterly revenue | $840,000 | $756,000 (10% lower) |
| Gross profit at a 75% margin | $630,000 | $567,000 |
| Operating expenses | $705,000 | $705,000 |
| Quarterly operating loss | −$75,000 | −$138,000 |
| Monthly net burn | $25,000 | $46,000 |
| Cash on September 30 | $735,000 | $735,000 |
| Runway | $735,000 ÷ $25,000 = 29.4 months | $735,000 ÷ $46,000 = 16.0 months |
The page tells the board something the P&L alone does not. The company misses plan by $33,000 in the quarter (our arithmetic from the table above), yet the downside case still leaves 16.0 months, which is above the 12 months a venture lender looks for6. The explanation for the board is two sentences: new-customer MRR and churn ran behind plan, and hiring ran ahead. The response line is a decision: hold the open sales hire until new MRR returns to $12,000.
Common mistakes
Median lists the process failures that cost trust. They include sending the package the night before, numbers that disagree between slides, a variance with no reason and mixed cash and accrual figures3. For the disagreement, the example is a burn rate of $87K on one slide and $94K implied by the cash flow statement, which the board will notice3. For the missing reason, “revenue came in below plan” tells the board nothing, while a stated driver tells them what happened3.
Add the two ways a package fails by size: a pack that buries the decisions under appendices11, and a package of numbers with no narrative, which leaves the board to interpret the figures themselves, often more conservatively than management would1.
Common questions
How to present financials to the board?
Start with a one-paragraph summary of what was planned, what happened and what it means, then show the statements, burn and runway, and budget-versus-actual with a reason for each material variance3, 1. Compare numbers with targets or prior periods so the board has context2. Send the pre-read at least two days ahead2.
How to write a financial plan for a startup business?
The SBA asks for a prospective financial outlook for the next five years, with forecasted income statements, balance sheets, cash flow statements and capital expenditure budgets9. For the first year it asks for quarterly or even monthly projections, explained and matched to the funding request9.
RelatedBurn rate and runway: formulas, example and benchmarksStartup annual budget: how to build one, with exampleARR vs MRR: difference, formula and when to use each
Sources
- The Startup Board Reporting Package: What to Include and How to Build It (October 5, 2026) · Kruze Consulting · kruzeconsulting.com · checked October 21, 2026
- Startup Board Financial Reporting: Examples, Templates, and Benchmarks (August 27, 2024) · Burkland Associates · burklandassociates.com · checked October 21, 2026
- How to Prepare a Financial Package for Your Board Meeting · Median · medianfi.com · checked October 21, 2026
- Manage your finances · U.S. Small Business Administration · sba.gov · checked October 21, 2026
- Commission Guidance on Management's Discussion and Analysis (Release 33-10751): key performance indicators and metrics · U.S. Securities and Exchange Commission · sec.gov · checked October 21, 2026
- TriplePoint Venture Growth BDC Corp. Form 10-K for the fiscal year ended December 31, 2025 · TriplePoint Venture Growth BDC Corp. (SEC filing) · sec.gov · checked October 21, 2026
- Accounting Standards Update 2014-15, Presentation of Financial Statements, Going Concern (Subtopic 205-40) · Financial Accounting Standards Board · storage.fasb.org · checked October 21, 2026
- 8 Del. C. 141, Board of directors; powers; reliance upon books (Delaware Code Online, Title 8, Chapter 1, Subchapter IV) · State of Delaware · delcode.delaware.gov · checked October 21, 2026
- Plan your business: write your business plan · U.S. Small Business Administration · sba.gov · checked October 21, 2026
- How to build a healthy budget for your startup · Mercury · mercury.com · checked October 21, 2026
- What Is a Board Pack? A Startup CEO's Guide · ImBoard · imboard.ai · checked October 21, 2026
- Best Practices for Startup Board Reporting · Lucid Financials · lucid.now · checked October 21, 2026
Published . Rules and rates change: each source shows the day it was read. Education only, not advice. How we check facts · Report an error.