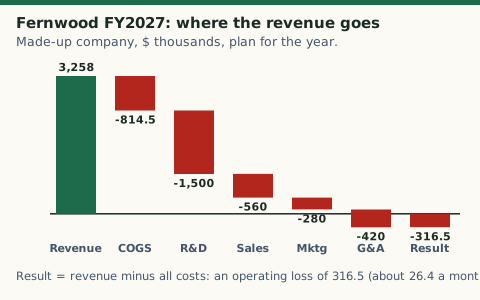
Fernwood, a made-up software company, has $2,400,000 of annual recurring revenue on the first of January, $900,000 in the bank and a board meeting in three weeks. The question on the agenda is plain: what will next year cost, what will it bring in, and how much cash is left on the last day? Nobody in the room can answer from the bank balance, because the balance only reports the past. The annual budget is the document that answers it, and it is the one finance deliverable that every other number in the company gets compared against for twelve months.
This page builds Fernwood’s budget step by step, shows the arithmetic with the final result, and checks the plan against a survey of private SaaS spending. It sits in operations, and it leans on two neighbours: how a month of spending turns into runway, and how the revenue base itself is defined in ARR vs MRR.
What a startup annual budget is
An annual budget has two parts: inflows, the money you expect to bring in, and outflows, the money you plan to spend, whether on creating the product or on day-to-day operations2. The version most companies use is the operating budget, which focuses on projected revenue and expenses over a given period, much like a future profit and loss statement3. It is updated regularly, usually monthly or quarterly, so spending stays on plan3.
It is a plan of record, not a prediction. Pilot is blunt about the limit: it is rare for anyone to get a forecast 100% right2. What the budget gives you is a baseline to be wrong against. A company with no baseline cannot tell whether a bad month is a surprise or the schedule.
The budget is the strategy in numbers
Jeffrey Bussgang, a venture investor writing about budget season, puts the link between plan and money in one line: a startup’s budget is its strategy, and its strategy is its budget1. His practical rule follows from it. The budget should be built to support strategic goals set first, and he suggests defining 4-6 measurable objectives for the year before any line is priced1. A line that supports no objective is the first candidate to cut.
Mercury makes the same point from the spending side. Two startups with similar funding can allocate it very differently, because a product-led company and a sales-led company are buying different things6. That is why no template can be copied wholesale: the template shows the lines, and only the strategy decides the amounts.
When to build it and who is in the room
Large companies start annual plans in late summer or fall. Startups plan later, because there is typically too much uncertainty to plan more than a month or two ahead1. In practice that puts the work in the last quarter of the year, ahead of the board meeting where the plan of record is approved.
Bussgang warns against the founder who dictates the numbers and discovers at year-end that the detailed assumptions were wrong from the team’s point of view1. Mercury agrees that even a team of one needs buy-in: the head of marketing should understand the amount dedicated to advertising or content6. But the process is not a pure bottom-up exercise either. Bussgang wants a clear vision pushed down, with founders asking their teams to stretch but not break1.
The six steps
The steps below follow the order a controller works in. Each ends in one number that feeds the next.
- Calculate your monthly revenue. Build it from drivers, not from a growth percentage pulled from the air.
- Subtract the cost of revenue. What is left is gross profit.
- Determine your fixed costs. The commitments that do not move with sales.
- Estimate your variable costs. The ones that rise and fall with activity.
- Plan headcount and cash. Payroll is the biggest line, and cash is the constraint.
- Tally up total costs, then review and adjust. Compare the plan with actual results every month.
Step 1: Calculate your monthly revenue
Revenue is the amount you expect to make from selling goods and services over a period, and the U.S. Chamber suggests thinking in months3. A company with history can estimate from it: use the last three months, or the same month a year earlier3. A company with no sales history has to use market research and industry benchmarks to forecast as best it can3.
For a software company the better method is to forecast the drivers. Bussgang lists what that means for a business-to-business startup: the number of qualified leads, free-trial conversion rates, average contract value (ACV), and churn or net dollar retention1. Pilot gives the same logic in general terms. Examples of revenue drivers are website traffic or sales leads, and as they go up your revenue might go up with them2. Pilot also shows how trends turn into estimates: with two sales reps averaging 10 sales a month, hiring a third might lift sales to 15 a month2.
Subscription revenue needs one definition at the start. Pilot’s example: a client who buys a 3-year subscription for $6000 contributes $2000 of annual recurring revenue (ARR), which is $6000 divided by three years2. ARR vs MRR covers how companies define the number differently.
Worked example (our arithmetic): Fernwood’s revenue build, monthly recurring revenue (MRR) bridge (driver method from1 and2; every input is made up)
| Input | Amount per month |
|---|---|
| Opening MRR on January 1 | $200,000 |
| New MRR from new customers | +$12,000 |
| Expansion MRR from existing customers | +$2,000 |
| Churned MRR (1.5% of opening MRR) | −$3,000 |
| Net new MRR | +$11,000 |
| Closing MRR after 12 months | $200,000 + 12 × $11,000 = $332,000 |
| Year-end ARR | $332,000 × 12 = $3,984,000 |
| Revenue recognized in the year (sum of 12 months, each month at its closing MRR) | $3,258,000 |
The revenue line is the sum of twelve months: 12 × $200,000 plus $11,000 × (1 + 2 + … + 12), which is $2,400,000 + $858,000 = $3,258,000. It is lower than year-end ARR because the base grows through the year. Treating a run rate as the year’s revenue is the commonest overstatement in a first budget.
Step 2: Subtract the cost of revenue
Cost of revenue, or cost of goods sold (COGS), is what you spend to create the product or service. For software and services companies it includes any costs directly tied to providing the service to clients, such as hosting servers2. Sales and marketing are not in COGS, because they are promotion costs and are counted elsewhere2. Subtract COGS from revenue to get gross profit, the profit before any other costs2.
Gross profit tells you how efficiently the product is delivered. Pilot’s reading: if gross profit is lacking, look at lowering COGS or raising revenue2.
Worked example (our arithmetic): Fernwood’s gross profit (formula from2)
| Line | Amount |
|---|---|
| Revenue | $3,258,000 |
| Cost of revenue: hosting, support and customer success, at 25% of revenue | −$814,500 |
| Gross profit | $2,443,500 (75% of revenue) |
Step 3: Determine your fixed costs
Fixed costs do not change with an increase or decrease in production or services4. The U.S. Small Business Administration (SBA) lists rental lease payments, salaries, property taxes, insurance, interest and depreciation as examples4. Costs that are paid less often than monthly still count: a charge paid quarterly that does not change with production is divided by four to get its monthly amount4.
Salaries sit in fixed costs in the SBA’s list, which is why a hiring plan moves a budget more than any other decision. Mercury recommends listing essential, fixed costs first because they are the most predictable, then costs that are essential but vary monthly, then one-time costs such as computer equipment6.
Step 4: Estimate your variable costs
Variable expenses change from month to month with the business’s activity, such as sales or production volume3. They are the part of the budget where choices are still open: if a month’s sales forecast is lower, the variable costs are what you can lower3. Real costs are often mixed. For the break-even math to be accurate, the SBA recommends separating semi-variable costs into their fixed and variable parts where possible4.
Mercury’s sorting scheme works as a template for the fixed-cost and variable-cost steps together. It separates expenses into essential and nice-to-have, and then into fixed, variable and one-time6.
| Category | What goes in it | Source for the split |
|---|---|---|
| Fixed | Salaries, rent, insurance, annual software contracts | 4, 6 |
| Variable | Hosting that scales with usage, sales commissions, paid advertising | 3, 6 |
| One-time | Equipment, legal setup, a logo or website build | 4, 6 |
| Nice-to-have | Conferences, extra tools, brand campaigns | 6 |
The SBA also separates one-time expenses, the initial costs needed to start, from monthly ones; adding the two shows how much capital is needed and when4.
Step 5: Plan headcount and cash
Payroll operating expenses cover more than salary. They include health insurance, paid time off, payroll taxes and any other benefits2. Non-payroll operating expenses are everything else spent running the business, from rent and utilities to marketing and research2. Subtracting both from gross profit gives operating income, the line that shows whether normal operations make or lose money2.
Operating loss is not cash burn. Pilot cautions that the financial budget, especially on an accrual basis, does not reflect the exact timing of cash in and out, and customer payment dates and rent dates both move actual cash2. The cash plan is a separate layer on top. It also has to deal with funding: when preparing a budget, think about how to allocate new funds and your spending if fundraising takes longer than planned2.
Bussgang frames the expense decision as an acceptable budgeted loss, balanced against the gross margin the revenue forecast produces1. The test he applies is whether the company loses too much money before reaching the milestones that unlock the next round at a higher valuation1.
Worked example (our arithmetic): Fernwood’s operating plan (formulas from2; headcount costs are loaded, meaning salary plus benefits and payroll taxes)
| Function | Build | Annual cost |
|---|---|---|
| Research and development | 10 people × $150,000 | $1,500,000 |
| Sales | 4 people × $140,000 | $560,000 |
| Marketing | Programs and tools, plus part of one role | $280,000 |
| General and administrative | Finance, legal, audit, insurance, office | $420,000 |
| Operating expenses | $2,760,000 | |
| Gross profit | $2,443,500 | |
| Operating income | $2,443,500 − $2,760,000 | −$316,500 |
| Per month | −$316,500 ÷ 12 | −$26,375 |
With $900,000 in the bank, the plan consumes $316,500 over the year, which leaves about $583,500 on December 31 if timing differences are ignored. At the same monthly rate that is a little over 22 months of further runway: $583,500 ÷ $26,375 ≈ 22.1. The runway method is the one in burn rate and runway.
Step 6: Tally up total costs, then review and adjust
The budget is finished only when it is wired to a review. The U.S. Chamber calls it a living tool and recommends monthly or quarterly reviews to spot trends in spending or revenue sooner3. In each review, compare actual results against budgeted figures and look for significant variances, then work out why they happened: higher sales, unexpected costs or market shifts3.
Mercury narrows the rule of revision. Review the budget monthly against actuals, but revise it only when a meaningful trend or major shift emerges6. Without that discipline the budget turns into a rolling re-forecast and stops being a yardstick. A budget revised every month can never be missed, so it can never teach anything.
Zero-based or incremental: two ways to start
Most startups’ second budget starts from the first. Traditional budgeting begins with the previous year’s figures and applies incremental increases or decreases, usually in the range of 1% to 10%7. Zero-based budgeting (ZBB) starts from nothing: it allocates funding on efficiency and necessity rather than history, and every expense must be justified to get in7.
Neither is free. ZBB is substantially more complex and tedious than starting from last year’s figures7. Corporate Finance Institute cites an Accenture study in which only about 50% of companies could sustain cost savings for more than one to two years7. For a company in its first or second budget the practical answer is usually incremental for lines that are stable, and zero-based for the lines that are large and uncertain, which in most software companies means the hiring plan. That reading is the editors’ judgment, not a finding from the sources.
Check the plan against a benchmark
A budget with no outside reference can drift into private assumptions. SaaS Capital publishes the most useful public reference for private software companies. Its 15th annual survey, completed in March 2026, drew more than 1,000 SaaS company responses5. Respondents were asked what percentage of revenue they currently spend on each function, and the instructions said percentages should total less than 100 for a profitable company and more than 100 for one that is not5.
The medians, as a percent of annual recurring revenue5:
| Function | Median, all respondents | Typical company at $3-5M ARR |
|---|---|---|
| Research and development | 22% | 24% |
| Selling costs | 15% | 12% |
| General and administrative | 15% | 15% |
| Marketing | 8% | 8% |
| Customer support and success | 9% | 10% |
| Hosting | 5% | 5% |
Total median spend across departments is 96% of ARR for bootstrapped companies and 101% for equity-backed ones5. Of the bootstrapped companies, 17% operate at a loss; of the equity-backed ones, 48% do5. Growth differs too: bootstrapped companies grow 20% a year at the median and venture-backed ones 25%5. One possible reason equity-backed companies spend more on general and administrative is the need for a robust administrative and finance team to support investor reporting, including regular board meetings and audits5.
Worked example (our arithmetic): Fernwood against the $3-5M band (Fernwood’s year-end ARR is $3,984,000, inside the band; band medians from5)
| Function | Fernwood plan | % of year-end ARR | Band median5 |
|---|---|---|---|
| Research and development | $1,500,000 | 37.7% | 24% |
| Selling costs | $560,000 | 14.1% | 12% |
| Marketing | $280,000 | 7.0% | 8% |
| General and administrative | $420,000 | 10.5% | 15% |
Two readings are available. Research and development is far above the median, a choice the budget makes visible and the board can discuss. General and administrative is below it, which could mean lean or could mean under-built finance and compliance. The benchmark does not decide either question. SaaS Capital’s medians are calculated line by line, so they do not sum to a single budget, and a median is not a target5.
Contingency, scenarios and the cash cushion
Plans usually fail on revenue first. Scenario planning lets spending shift quickly across different revenue outcomes and keeps flexibility in the budget6. Agreeing in advance on revenue benchmarks that trigger spending increases releases hiring on results, not optimism6.
On the safety margin, the sources differ. Mercury aims for enough cash to cover at least 3 to 6 months of essential operating expenses, with a larger cushion for earlier-stage startups whose revenue is less predictable6. The U.S. Chamber quotes one adviser who sets aside 10% of business revenue for unexpected changes or new opportunities3. The SBA adds 10% to its break-even analysis for miscellaneous expenses that cannot be predicted4. Those are three different bases (essential expenses, revenue, break-even costs), so they are not interchangeable.
Mercury’s example of what to protect and what to cut shows the point of a scenario. If revenue comes in below plan, paid marketing tests and conference travel go first, while payroll, infrastructure, accounting and hosting are protected6.
Worked example (our arithmetic): Fernwood if revenue lands 10% under plan (cost of revenue stays at 25% of revenue; operating expenses as budgeted; savings from the two paused hires computed from the $140,000 loaded sales cost in the plan)
| Scenario | Revenue | Cost of revenue | Operating expenses | Operating income |
|---|---|---|---|---|
| Plan | $3,258,000 | $814,500 | $2,760,000 | −$316,500 |
| Revenue 10% under plan | $2,932,200 | $733,050 | $2,760,000 | −$560,850 |
| Revenue 10% under, two planned second-half hires paused | $2,932,200 | $733,050 | $2,620,000 | −$420,850 |
Pausing two hires for half a year saves 2 × $140,000 ÷ 2 = $140,000. The shortfall is $244,350 against plan, and pausing the hires recovers $140,000 of it, which leaves $104,350 for other levers. That gap is what a scenario table exists to show early.
The monthly variance review
A variance is the difference between budget and actual. The review needs a rule for which variances matter, or it becomes a debate. Mercury’s suggestion is a threshold: department owners manage variances under 5-10% without escalation, while anything above 10%, or any unplanned expense that affects runway, goes up6. A short agenda keeps the meeting on decisions: cash, burn and runway first, then actual versus budget, then the largest variances and their causes6.
Worked example (our arithmetic): one month of Fernwood’s marketing line (threshold from6)
| Item | Amount |
|---|---|
| Monthly budget: $280,000 ÷ 12 | $23,333 |
| Actual spend | $25,900 |
| Variance | +$2,567, which is 11.0% over budget |
| Rule | Above 10%, so it is escalated |
At 11.0% the owner cannot absorb the difference alone. The question the review asks is why: a one-time event bill, a vendor price rise, or a new campaign that the plan did not include. Each leads to a different decision.
Is $20,000 enough to start a business?
It depends on the business, and the published estimates do not agree. HubSpot reports one founder’s expectation of at least $10,000 for the first year, and another source’s average of $30,000 to $50,0009. For a software team that hires, the cost of people dominates: HubSpot puts hiring five employees at an average of $300,500 in the first year9. At that level $20,000 would pay for under a month of a five-person team’s payroll (our arithmetic: $300,500 ÷ 12 is about $25,000 a month). The same article quotes an entrepreneur who expects to answer the first-year validation questions for less than $1M, and often less than $0.5M9.
Months of burn is a better unit than dollars. A solo founder spending $4,000 a month in total has 5 months from $20,000 (our arithmetic: $20,000 ÷ $4,000), using the method in burn rate and runway. The SBA’s startup cost method is the dependable starting point: list one-time and monthly costs, add them, and see how much capital is needed and when4. Calculating startup costs also helps estimate profits, run a break-even analysis, secure loans and attract investors4.
How start-up costs are treated for tax
One U.S. tax rule changes how pre-launch costs show up. Business start-up costs are the expenses incurred before operations begin, and they may include advertising, travel, surveys and training13. Under 26 U.S.C. 195, no deduction is allowed for start-up expenditures unless the taxpayer elects the special treatment8. IRS Publication 583 gives the short version: an election can deduct up to $5,000 of start-up costs, reduced by the amount the costs exceed $50,000, and any remaining costs must be amortized13. In the statute’s words, with the election, the taxpayer deducts the lesser of the actual amount or $5,000 in the year the business begins, reduced dollar for dollar by the amount that start-up expenditures exceed $50,000, and deducts the remainder ratably over 180 months from the month the business begins8. The election is due by the filing deadline, including extensions, for the year the business begins8. Amounts that qualify for deductions under sections 163(a), 164 or 174 are not start-up expenditures under this section8. The code text above is the 2023 edition; a tax professional should confirm current amounts.
Worked example (our arithmetic): two start-up cost totals (formula from8)
| Pre-launch costs of $20,000 | Pre-launch costs of $54,000 | |
|---|---|---|
| Year-one deduction | lesser of $20,000 and $5,000 = $5,000 | $5,000 − ($54,000 − $50,000) = $1,000 |
| Remainder | $15,000 | $53,000 |
| Spread over 180 months | $83.33 a month | $294.44 a month |
Under these rules a made-up pre-launch spend of $20,000 is not fully deductible in the year it is spent, even with the election, so cash and tax deductions move on different schedules8, 13.
Break-even, and why the budget needs it
The break-even point is where total cost and total revenue are equal, with no loss or gain4. The SBA’s unit formula is fixed costs divided by the price per unit minus the variable cost per unit4. For a subscription business the unit is a customer-month, so it translates directly into a customer count.
Worked example (our arithmetic): Fernwood’s break-even customers (formula from4; the average-customer inputs are made up)
| Input | Amount |
|---|---|
| Monthly fixed costs: operating expenses $2,760,000 ÷ 12 | $230,000 |
| Revenue per customer per month | $800 |
| Variable cost per customer per month (25% cost of revenue) | $200 |
| Contribution per customer per month | $600 |
| Break-even customers: $230,000 ÷ $600 | about 384 |
Treating all of operating expenses as fixed is a simplification. The SBA also stresses that the break-even point is an estimate for lender viability and planning, not an accounting result4.
Budget rules of thumb: which fit a startup
Three percentage rules turn up whenever people search for budget advice, and each fits a different problem. Two belong to household finance: the 50/30/20 plan11 and the 70/10/10/10 split12. Both divide income that arrives as a paycheck. A company’s income is a forecast and its biggest cost is payroll, so the arithmetic does not transfer. The one idea worth borrowing is the ordering, needs before wants, which matches Mercury’s essential and nice-to-have split6.
The 80/20 principle is different, because it is about concentration. The University of Maryland Extension lists examples such as 80% of sales volume coming from 20% of customers and 80% of revenue from 20% of products10. In a budget it suggests a test: find the few cost lines and the few customers that carry most of the result, and spend review time there first. The same source is clear that it is not a law10.
Common mistakes in a first budget
- Revenue as run rate. Using year-end ARR as the year’s revenue, as the Fernwood bridge shows, overstates the year by hundreds of thousands of dollars.
- No contingency line. Several sources recommend a buffer, whether as months of cash6, a share of revenue3 or a margin in the break-even4.
- Hiring plan without triggers. The sources suggest agreeing in advance on the revenue benchmarks that release spending6.
- Budget that never changes, or changes monthly. The monthly review compares; the revision happens only on a meaningful trend6.
- Operating loss read as cash. Accrual timing means the two differ2.
Failure statistics circulate in this area, such as HubSpot’s report that about 82% of startups fail because of problems with cash flow, like burning money too quickly or not keeping a long enough runway between rounds9. HubSpot’s wording does not give a sample or a date, so treat it as a reason to care about cash, not as a measured rate.
What to do next
Build the revenue bridge first, since every later line depends on it. Then price the people. Then write down, before the year starts, the revenue level that releases each hire and the variance threshold that triggers escalation6. The related metrics are covered elsewhere on this site: SaaS churn rate sets the churn line in the revenue bridge, and how venture rounds work shows how new money changes the cash line.
Common questions
What is the 80/20 rule for startups?
The Pareto principle holds that in many cases roughly 80% of the effects come from 20% of the causes10. In a budget it points at concentration: a few customers, products or cost lines drive most of the result. It is a rule of thumb, not a law10.
What is the 70-10-10-10 budget rule?
It is a personal-finance split of take-home pay: 70% to everyday living expenses, 10% to savings, 10% to investments and 10% to debt repayment12. It was written for households, not companies, so a startup budget starts from revenue drivers and cash instead.
What is the 50/30/20 rule for business?
The 50/30/20 plan divides a household's spendable dollars into needs (50%), wants (30%) and debt and savings (20%)11. Its authors aimed it at household finances11. A company can borrow the needs-versus-wants idea, but the percentages are not a business standard.
Read next
Finance operations
Burn rate and runway: formulas, example and benchmarks
Burn rate is the cash a startup uses each month and runway is how many months it lasts: formulas, a worked example, benchmarks and the going-concern test.
SaaS metrics
SaaS churn rate: formula, examples and benchmarks
Churn rate is the share of customers or recurring revenue lost in a period: the formulas, a worked example, benchmarks and how public filers define it.
Fundraising mechanics
How venture rounds work: seed to exit, step by step
How a startup funding round works: who invests at each stage, SAFEs and convertible notes, the Series A paperwork, investor rights and the ways a company exits.
Sources
- How to Develop Your Startup's Annual Budget and Plan (in the age of generative AI) · Jeffrey Bussgang, Bussgang's Bullets (LinkedIn, November 30, 2023) · linkedin.com · checked October 21, 2026
- Annual Budgeting Guide · Pilot (August 5, 2024) · pilot.com · checked October 21, 2026
- Small Business Budgeting Guide · U.S. Chamber of Commerce · uschamber.com · checked October 21, 2026
- Plan your business: calculate your startup costs and break-even analysis · U.S. Small Business Administration · sba.gov · checked October 21, 2026
- 2026 Spending Benchmarks for Private B2B SaaS Companies (June 10, 2026) · SaaS Capital · saas-capital.com · checked October 21, 2026
- How to build a healthy budget for your startup · Mercury · mercury.com · checked October 21, 2026
- Zero-Based Budgeting · Corporate Finance Institute · corporatefinanceinstitute.com · checked October 21, 2026
- 26 U.S.C. 195, Start-up expenditures (United States Code, 2023 Edition) · U.S. Government Publishing Office · govinfo.gov · checked October 21, 2026
- Planning a Tech Startup Budget to Keep Costs Low · HubSpot · hubspot.com · checked October 21, 2026
- Applying the Pareto Principle in Your Marketing, the 80/20 Rule (updated June 4, 2021) · University of Maryland Extension · extension.umd.edu · checked October 21, 2026
- The 50/30/20 Rule for Budgeting · InCharge Debt Solutions · incharge.org · checked October 21, 2026
- 70/10/10/10 Budget Rule: A Flexible Way to Manage Money · Embark · embark.ca · checked October 21, 2026
- Publication 583 (12/2024), Starting a Business and Keeping Records · Internal Revenue Service · irs.gov · checked October 21, 2026
Published . Rules and rates change: each source shows the day it was read. Education only, not advice. How we check facts · Report an error.