On this page
- The seven habits at a glance
- Habit 1: protect retention before buying growth
- Habit 2: grow efficiently, and check it against the Rule of 40
- What is the rule of 40 in SaaS?
- Habit 3: repay customer acquisition cost in months
- Habit 4: hold gross margin
- Habit 5: know the spend mix
- Habit 6: plan growth honestly
- What is the 3-3-2-2-2 rule of SaaS?
- Habit 7: price against the value delivered
- Will SaaS be replaced by AI?
- Is it true that 90% of startups fail?
- What the practitioner essays add
- Using the habits
Habit lists for SaaS are cheap to write and hard to use. “Talk to customers” and “ship fast” cannot be checked against a spreadsheet, so no one can tell whether the company has the habit or only the slogan. This page keeps only habits that leave a number behind, gives the benchmark for each with its source and sample, and says where the evidence is thin. It sits in operations, and the finance mechanics behind each habit live on the neighbouring pages for net revenue retention, CAC payback and the annual budget.
The benchmarks come from three kinds of source, and the difference matters. SaaS Capital’s annual survey covers private B2B companies, with more than 1,000 responses in March 20264. A study by the advisory firm D’Ornano + Co. covers 20 publicly traded SaaS companies, based on Q2 figures5, so it describes large public companies, not a seed-stage startup. The rest are practitioner essays, which are opinion.
The seven habits at a glance
| Habit | The number to watch | Benchmark | Source |
|---|---|---|---|
| Protect retention | Net revenue retention (NRR) and gross revenue retention (GRR) | Median NRR 102% for $25,000 to $50,000 contracts3; public best-in-class about 120% NRR and 95% GRR5 | SaaS Capital; D’Ornano + Co. |
| Grow efficiently | Rule of 40 | Growth plus profit margin of 40% or higher6 | CFI |
| Repay CAC fast | CAC payback in months | Median 6 months, most under 105 | D’Ornano + Co. |
| Hold gross margin | Gross margin | Median 76% in the best-in-class public sample5 | D’Ornano + Co. |
| Know the spend mix | Spend as a share of ARR | R&D 22%, selling 15%, G&A 15%, marketing 8%4 | SaaS Capital |
| Plan growth honestly | Year-on-year ARR multiple | Triple, triple, double, double, double from $1m to $2m of ARR7 | SaaStr |
| Price against value | Share of revenue not sold per seat | 35% of future revenue expected from consumption or value pricing10 | Cruxy survey |
Habit 1: protect retention before buying growth
Revenue retention is among the most important metrics for medium- to long-term business health, because of its compounding effect on growth3. SaaS Capital frames it as the SaaS version of “offense wins games, defense wins championships”3. The definitions are short: churn is best described as one minus gross retention, so 95% gross retention equals 5% churn3; net retention adds the effect of upsells, so it is always higher than gross retention3; and gross retention cannot exceed 100%3. The churn rate and net revenue retention pages show the formulas.
The benchmark depends on contract size. Higher net retention correlates with higher annual contract values (ACV), and companies with the very highest ACVs have the highest gross retention3. For ACVs between $25,000 and $50,000 the median NRR is 102%, the top quartile reports 111% and the lowest quartile 97%3. Across companies with more than $1 million of ARR the median growth rate was 24%3, and higher retention goes with higher growth: “the higher your retention, the easier it is to grow that much faster because you don’t have to first refill the bucket”3.
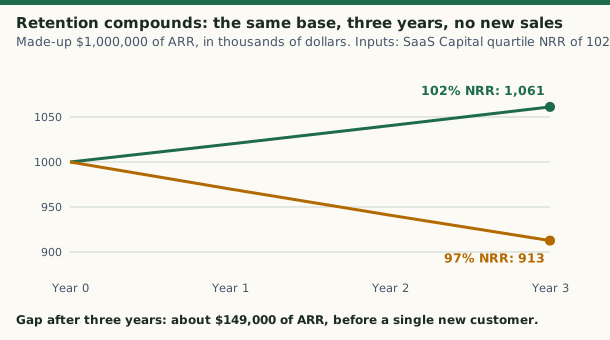
Worked example (our arithmetic): the same base at the two quartile edges, no new sales (retention rates from3; the $1,000,000 base is made up)
| Year | At 102% NRR | At 97% NRR |
|---|---|---|
| Start | $1,000,000 | $1,000,000 |
| After year 1 | $1,020,000 | $970,000 |
| After year 2 | $1,040,400 | $940,900 |
| After year 3 | $1,061,208 | $912,673 |
| Gap after year 3: $1,061,208 − $912,673 | $148,535 |
In our arithmetic, five points of retention are worth about 15% of the starting base after three years ($148,535 ÷ $1,000,000), before any sale. The public best-in-class sample sits far above both: about 120% NRR and 95% GRR5, a pool that the study itself calls small for GRR5.
Habit 2: grow efficiently, and check it against the Rule of 40
The advisory study’s conclusion about what separates the very best SaaS companies is efficient growth5. The most used test for it is the Rule of 40, which holds that the sum of the revenue growth rate and the profit margin should be 40% or higher6. It is a back-of-the-envelope calculation, not a valuation6, and it exists because growth and profitability often pull against each other6.
The inputs need a convention. Analysts favour recurring revenue for the growth rate because it is more predictable6, and the most common profit measure is EBITDA6. The same Rule can be passed in odd ways: a company with 100% growth and a negative 60% margin technically meets it6, which is why the sum is a prompt for analysis and not a verdict6. The median of the 20 public best-in-class companies reached the 40% bar5.
Worked example (our arithmetic): what margin clears the bar at each growth rate (formula and the 40% threshold from6; the 24% median growth is from3)
| Revenue growth | Margin needed for 40 | Result |
|---|---|---|
| 40% growth, 15% margin (CFI’s example) | none | 55%6 |
| 10% growth, 15% margin (CFI’s example) | 30% | 25%, below the bar6 |
| 24% growth, the SaaS Capital median3 | 40 − 24 = 16% | A median-growth company needs a 16% margin |
SaaS Capital’s spending data shows the practical difficulty. Total median spend is 96% of ARR for bootstrapped companies and 101% for equity-backed ones4; 83% of bootstrapped companies are within two percentage points of breakeven or profitable, against 52% of equity-backed ones4. Equity-backed companies buy more growth, with a median 25% against 20% for bootstrapped ones4. The Rule of 40 is the test of whether that purchase was efficient6.
What is the rule of 40 in SaaS?
The Rule of 40 says the sum of the revenue growth rate and the profit margin should be 40% or higher6. The formula is revenue growth rate plus profit margin6. A company growing 40% with a 15% margin scores 55%, and one growing 10% with a 15% margin scores 25%6. The threshold exists as a quick benchmark because heavy investment in growth can reduce profit6. The section on habit 2 has the worked table.
Habit 3: repay customer acquisition cost in months
Among the 20 public companies, most reached a CAC payback of less than 10 months, with a median of 6 months5. That is a large-company figure, measured on a gross-margin basis; a smaller company with a different sales motion will sit elsewhere, and the CAC payback page shows how to compute your own. The habit is to compute it on a schedule and to see which segment is slow, not to match 6.
The same sample shows where the new revenue comes from: the net new implied ARR split between new and existing customers reaches 63%5. A company that depends on new logos alone is exposed to the retention problem above. An enterprise-focused essay makes the behavioural point: far too many companies are still focused on landing new logos to the detriment of expanding penetration among their existing customers9.
Habit 4: hold gross margin
The best-in-class public sample has a median gross margin of 76%5. Gross margin is revenue after the cost of goods sold, and the typical costs are hosting, implementation and services5. For private companies the cost lines are visible in SaaS Capital’s survey: hosting at a median 5% of ARR4 and customer support and customer success at 9%4, up from 8% a year earlier4. A company that lets those lines drift loses margin quietly, and the annual budget is the place to catch it.
Habit 5: know the spend mix
A budget without a peer reference invites argument by anecdote. SaaS Capital’s March 2026 survey gives the private B2B medians as a share of ARR4:
| Line | Median share of ARR | Change from the prior year |
|---|---|---|
| Research and development | 22%4 | Unchanged4 |
| Selling costs | 15%4 | Up from 13%4 |
| General and administrative | 15%4 | Up from 14%4 |
| Customer support and success | 9%4 | Up from 8%4 |
| Marketing | 8%4 | Unchanged4 |
| Hosting | 5%4 | Unchanged4 |
Funding source changes the picture. Equity-backed companies spend 64% more on general and administrative costs, 70% more on sales, 100% more on marketing, 56% more on R&D and 100% more on customer success than bootstrapped ones4. The survey’s own explanation for the administrative gap is the need for a finance team that supports investor reporting, regular board meetings and audits4. That is the cost side of the stages described in how finance matures, and the audit requirement becomes formal at the public-company stage: the SEC lets an emerging growth company, one with total annual gross revenues of less than $1.235 billion, provide audited financial statements for two fiscal years instead of three11.
Habit 6: plan growth honestly
The popular pace has a name. The “triple, triple, double, double, double” pattern, usually shortened to T2D3, says that a company that triples in the first year after passing $1 million to $2 million of ARR, triples again, and then doubles in each of the next three years has a good shot at becoming a unicorn7. SaaStr traces the idea to Neeraj Agarwal of Battery Ventures7 and adds that this growth compounds into $100 million or more of ARR pretty frequently7.
What is the 3-3-2-2-2 rule of SaaS?
It is T2D3 under another spelling: triple twice, then double three times, starting from the first $1 million to $2 million of ARR7. It is a pattern observed in venture-backed winners, not a law and not a plan every company should hold itself to7.
Worked example (our arithmetic): the T2D3 path from $2,000,000 of ARR (multiples from7; the starting point is within the $1m-$2m range it names)
| Year | Multiple | ARR at year end |
|---|---|---|
| Start | n/a | $2,000,000 |
| 1 | 3× | $6,000,000 |
| 2 | 3× | $18,000,000 |
| 3 | 2× | $36,000,000 |
| 4 | 2× | $72,000,000 |
| 5 | 2× | $144,000,000 |
Five years of the pattern clear $100 million, which matches the compounding claim7. The bar has moved. A 2024 SaaStr post argues that growth investors at $10 million of ARR now look for tripling, “T3D3”, not doubling7. Its example: one company went from $11 million of ARR to $32 million, then 2.5 times to $78 million, then doubled to $161 million7. Our arithmetic on those figures: $32m ÷ $11m is 2.9×, $78m ÷ $32m is 2.4× and $161m ÷ $78m is 2.1×.
Two cautions apply. The same post tells readers that you can get to $100 million or more of ARR growing very nicely without ever quite hitting those growth numbers7. And a SaaStr essay on what makes SaaS companies successful puts the timeline at seven to ten years minimum to get anywhere8, in a field of 10,000 or more start-ups8. Pace is a venture-capital expectation, and it is a poor target for a company that does not plan to raise.
Habit 7: price against the value delivered
The newest habit is the least settled. A survey of 300 B2B SaaS CEOs in the UK and US found 97% likely to retire seat-based pricing, even though 94% said it still reflects product value today10. The same survey found 85% see AI as a direct threat to their business model and 82% said customers had asked for AI-related price cuts10. It was commissioned by a pricing firm, so read it as stated intent, not observed behaviour. The logic holds regardless: if fewer human users are needed to do the same work, the link between a customer’s headcount and the value they receive becomes less clear10.
For a finance team this is a forecasting issue before it is a pricing issue. CEOs in the survey expect 35% of future revenue to come from consumption-based or value-based pricing10, and recurring-revenue metrics were built for subscriptions that renew per seat.
Will SaaS be replaced by AI?
No source reviewed for this page shows software subscriptions being replaced. What the evidence shows is repricing. In the Cruxy survey, 54% of CEOs said customer-built solutions, which the research calls “vibe-coding”, were the bigger threat, and 45% said AI-first start-ups taking market share10. That is a survey of vendors, with a stated commercial interest in pricing change, so it measures worry, not outcomes. The practical habit is the one above: watch the retention and pricing mix quarterly, not the headlines.
Is it true that 90% of startups fail?
Not on the data available here. The U.S. Bureau of Labor Statistics follows cohorts of new business establishments, and 34.7% of those born in March 2013 were still operating in March 20231. Put differently, one-third of the businesses created in March 2013 survived a decade1. That is about 65% closed in ten years, a high number but not 90%. Our arithmetic: 100% − 34.7% = 65.3%.
Three limits matter. The count is of establishments, not companies, and it covers all private-sector businesses, not venture-backed software1. Survival rates vary by industry, as the BLS Business Employment Dynamics program shows2. And survival rates follow a similar path regardless of the birth year2, so the shape of the curve is stable even when the level is not. A 90% figure for venture-backed startups would need its own source and a stated definition of failure; none is used here.
What the practitioner essays add
Two essays add habits that cannot be benchmarked but are worth testing against the numbers above. Think customer-in, not company-out9: for a company in an early market, the success factor is to stay narrow and go deep9. And Customer Success is a business strategy, not a sales tactic9. Their financial form is retention again: the account manager who finds a new use case inside an existing customer is lifting NRR.
The same essay proposes a resource split of 40:20:20:20 across engineering, sales, high-value services and everyone else9. It is an advisor’s judgement and no benchmark supports it, so treat it as a conversation starter, and compare it with the spend mix above.
Using the habits
Pick the one habit where your own number is furthest from the table and fix that first. For most companies that is retention, because it compounds3. Review all seven quarterly, with the definitions fixed in advance so a changed formula does not look like improvement. Benchmarks from private-company surveys apply to private companies4; the public-company figures here show what the top of the market looks like, not what a Series A company should hit5.
RelatedNet revenue retention: formula, example, benchmarksCAC payback period: formula, example and benchmarksStartup annual budget: how to build one, with example
Sources
- 34.7 percent of business establishments born in 2013 were still operating in 2023 · U.S. Bureau of Labor Statistics, The Economics Daily · bls.gov · checked October 22, 2026
- Entrepreneurship and the U.S. Economy · U.S. Bureau of Labor Statistics, Business Employment Dynamics · bls.gov · checked October 22, 2026
- What is a Good Retention Rate for a Private SaaS Company in 2025? (September 18, 2025) · SaaS Capital · saas-capital.com · checked October 22, 2026
- 2026 Spending Benchmarks for Private B2B SaaS Companies (June 10, 2026) · SaaS Capital · saas-capital.com · checked October 22, 2026
- 10 Habits Of A Highly Efficient/Successful SaaS Company (study dated September 25, 2023) · D'Ornano + Co. · linkedin.com · checked October 22, 2026
- The SaaS Rule of 40 Explained (October 22, 2024) · Corporate Finance Institute · corporatefinanceinstitute.com · checked October 22, 2026
- Is It Now T3D3 For Top Tier SaaS Startups? Probably. · SaaStr · saastr.com · checked October 22, 2026
- What are the characteristics of successful SaaS companies? · SaaStr · saastr.com · checked October 22, 2026
- The Seven Habits of Highly Successful Enterprise SaaS Companies · The Chasm Group · chasmgroup.com · checked October 22, 2026
- SaaS chiefs expect pricing shift as AI threatens sales (April 16, 2026) · CFOtech UK · cfotech.co.uk · checked October 22, 2026
- Emerging Growth Companies · U.S. Securities and Exchange Commission · sec.gov · checked October 22, 2026
Published . Rules and rates change: each source shows the day it was read. Education only, not advice. How we check facts · Report an error.